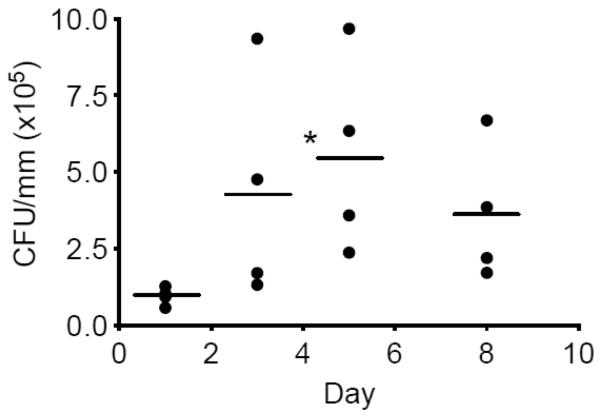
Figure 2. Quantification of anaerobic bacteria.
Bacteria were extracted from recovered sutures (at the indicated days following placement of ligatures) and serial dilutions of bacterial suspensions were plated onto blood agar plates for anaerobic growth and CFU enumeration. Each symbol represents an individual mouse; small horizontal lines indicate the mean. *, P < 0.05, as compared with day 1.

