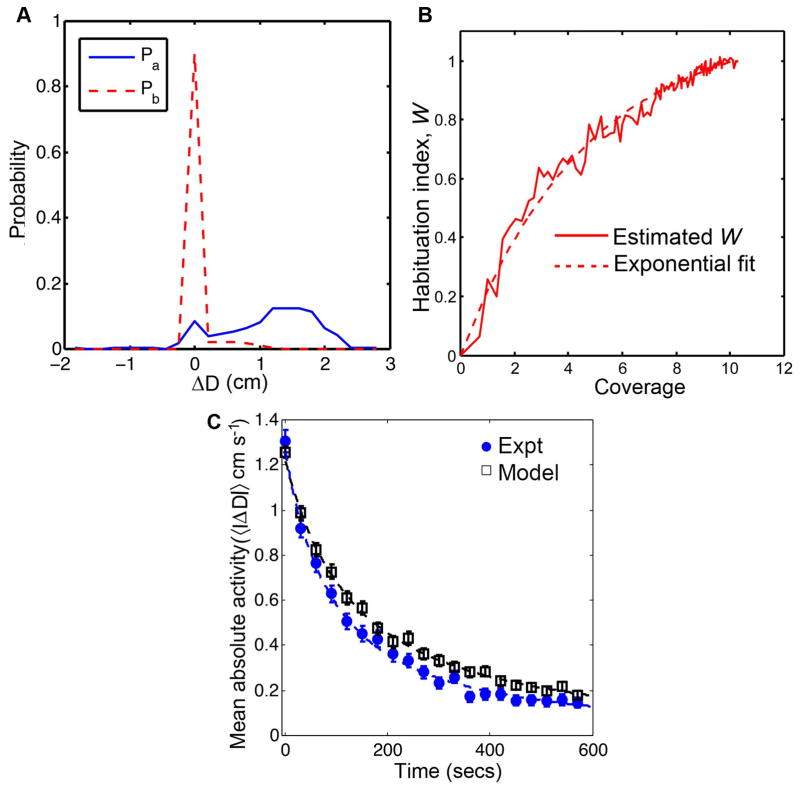
Figure 5. The habituation model gives an accurate form for the mean absolute activity in Drosophila in the 4.2 cm arena.
The estimated distributions Pa and Pb are shown in panel A while the estimated habituation index W is shown in B. The two densities were estimated from the trajectories of wild type flies in the circular arena of radius 2.5 cm. The distribution Pb peaks at ΔD =0, indicating that flies are more likely to pause during the later stages of exploration. Panel C shows 〈|ΔD|〉 obtained from experiments with Canton-S flies in circular arena of radius 4.2 cm and simulations using the memory model. For visualization purposes, 21 time points are shown in panel C. The interval between any two consecutive time points in the plots is 30 seconds. There was no statistical difference between the experiments and the simulations for 〈|ΔD|〉 (p = 0.9097, F(2,594) = 0.095). These results confirm (along with Figure 4C) that W(C) is independent of the arena.

