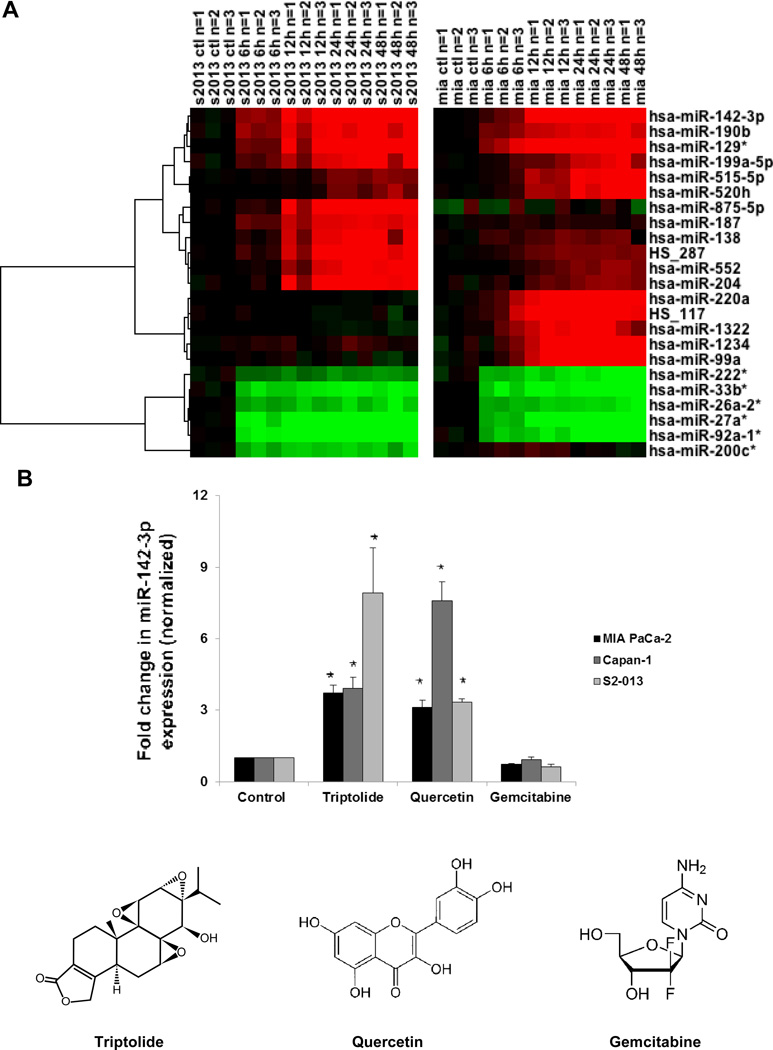
Figure 1. Triptolide-regulated microRNAs in PDAC cells.
(A) Heatmap representation of differentially expressed human miRNAs after triptolide (100 nM) treatment (0, 6, 12, 24 or 48 h) in MIA PaCa-2 and S2-013 cells as measured by microarray. Only miRNAs with strong differential expression (t-test between 0 and 24 hour replicate time points, p<0.05, average fold change>5) in at least one of the two time-courses are shown. Log-transformed expression values are shown, compared with the untreated control, for each cell line independently. (B) Triptolide (100 nM) and quercetin (100 μM) treatments induced, whereas gemcitabine (1 μM) treatment had no effect on, miR-142-3p expression (as assessed by real-time PCR) in human MIA PaCa-2, Capan-1, and S2-013 cell lines following 24 h of treatment. Expression of miR-142-3p was normalized against U6. The bars represent mean ± SEM, n=3, *p<0.02 (t test).

