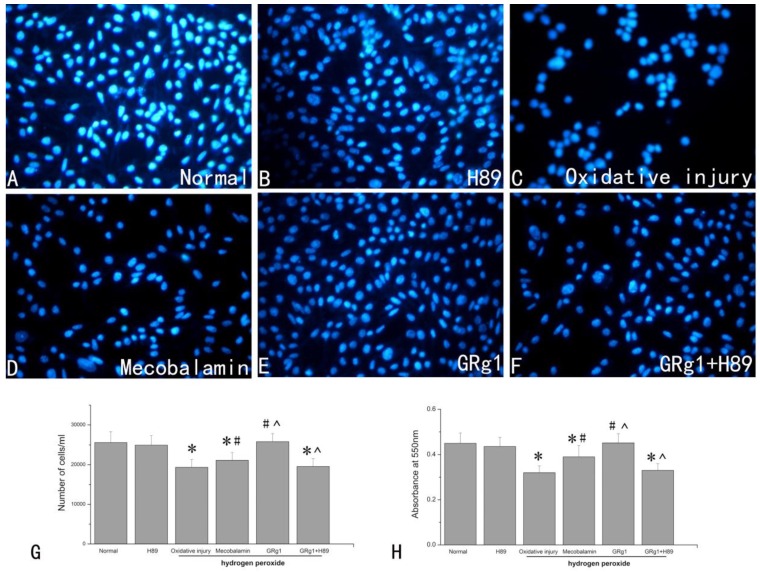
Fig 4.
Cell number (A-G) and cell viability (H) of SCs in each group after hydrogen peroxide-induced oxidative injury. SCs were visualized by DAPI staining in the normal group (A), H89 group (B), oxidative injury group (C), mecobalamin group (D), GRg1 group (E), and GRg1+H89 group (F). Magnification was 200x. The number of stained SCs (E). *p < 0.05 for the comparison with normal group. #p < 0.05 for the comparison with oxidative injury group. ^p < 0.05 for the comparison with mecobalamin group.

