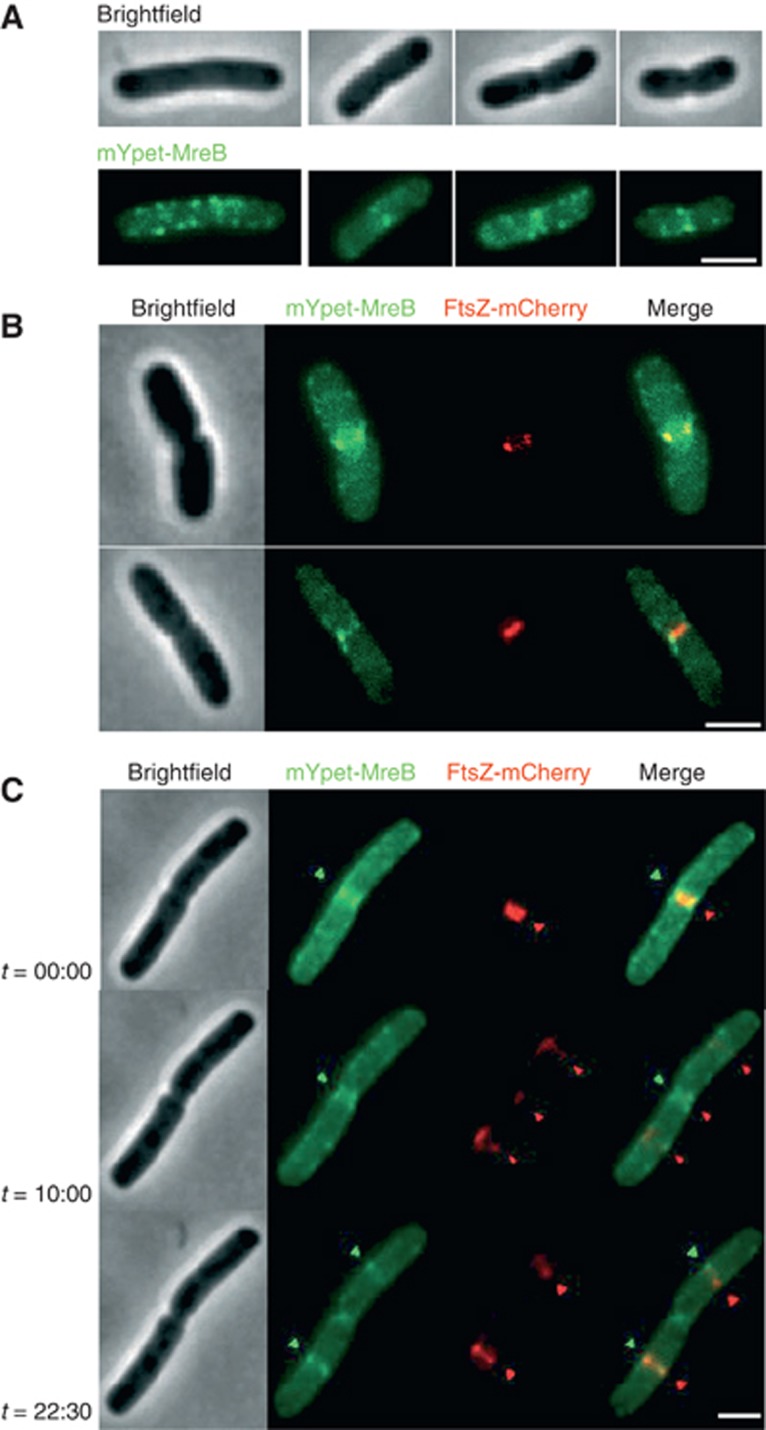
Figure 1.
MreB is recruited to the FtsZ ring. (A) Representative bright field and fluorescent micrographs of MG1655 expressing the mYpet–MreB fluorescent protein from pAKF106 (PBAD::mYpet–mreBCD). Examples of both non-dividing and dividing cells at different stages of cell division are shown. (B) Dual-label fluorescence micrographs of MG1655 expressing both the mYpet–MreB fusion from pAKF106 and FtsZ–mCherry from pQW59 (Plac::ftsZ–mCherry). Merged images reveal signals colocalised at mid-cell. Using this technique, MreBwt–FtsZ colocalisation frequency was 75% (499 Z rings scored, n=11). (C) Selected images from a time-lapse series following a single MG1655 cell expressing the same fluorescent proteins shown in B. Arrows indicate the location and colocalisation of major MreB foci and FtsZ rings. The full time-lapse series and additional MreB–FtsZ colocalisation examples are shown in Supplementary Figures S9 and S10. All cells were grown in M9 glucose media with 0.05% arabinose inducer at 30°C 3 h prior to imaging (see Supplementary Figure S1A and B for growth curves and western blot). Induction of the pQW59 plasmid was not required to give Z rings labelled with FtsZ–mCherry. All images shown are representative of at least three independent repeats. Scale bars=2 μm.

