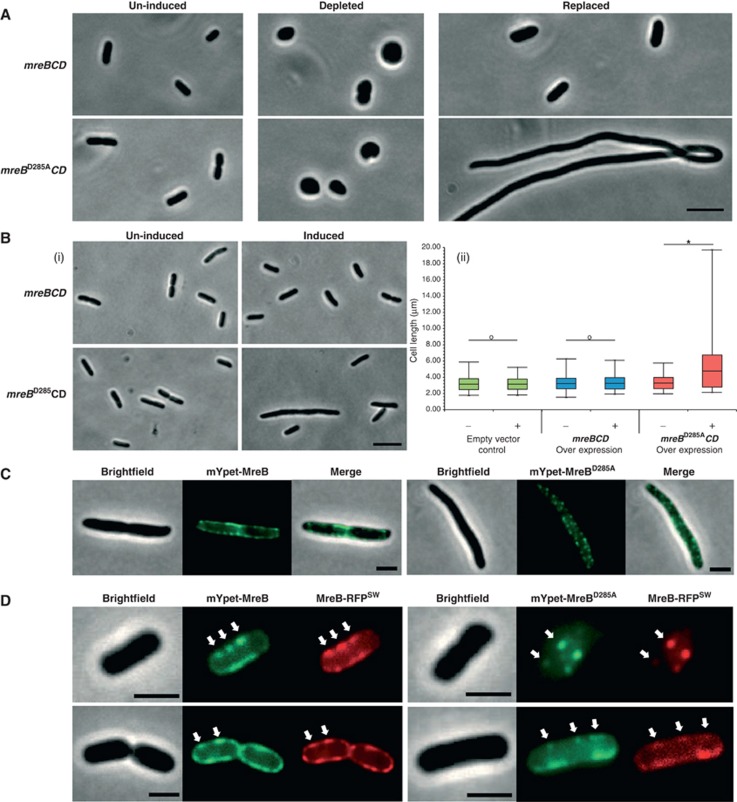
Figure 3.
The MreBD285A variant inhibits cell division but not cell elongation. (A) Representative brightfield micrographs showing the MC1000 MreBCD depletion strain (MC1000 Δmre, pKG339, pTK554). Images show cells without MreB depletion ‘un-induced’, depleted of MreB ‘depleted’ or complemented with either mreBCD or mreBD285ACD expressed from pAKF128 (PBAD::mreBCD) or pAKF129 (PBAD::mreBD285ACD) ‘replaced’. Cells were grown in LB +tetracycline (20 μM), 2 mM IPTG and 0.2% arabinose for 3 h at 30°C prior to imaging. See Supplementary Figure S4A for diagram of depletion system. (B) MC1000 cells containing pAKF128 or pAKF129. Cells were grown in M9 medium with 0.000,05% arabinose inducer at 30°C for 5 h. (i) Representative bright field micrographs of cells with and without induction (ii) Box and Whisker plot showing cell length measurements with mreBCD and mreBD285ACD ‘overexpression’ compared to an empty vector control (pBAD24). Central line=mean length, box=± s.d. and whiskers=maximum/minimum lengths observed. *t-test=P>0.01, o=no significant difference between populations. 670 cells were sampled for each condition, n=3. For cell width measurements and a full series of control images, see Supplementary Figure S4C and D. (C) Representative brightfield and fluorescent micrographs of MC1000 carrying pAKF131 (PBAD::mypet–mreBCD; left panel) or pAKF132 (PBAD::mypet–mreBD285ACD; right panel), n=3. Note the septal localisation of the mYpet–MreB versus the punctate localisation pattern of mYpet–MreBD285A. (D) mYpet–MreB (pAKF131) and mYpet–MreBD285A (pAKF132) colocalise with the MreB–RFPSW in the FB76 strain. Arrows have been used to highlight selected colocalising foci, n=3. Scale bars=5 μm (A, B) and 2 μm (C, D).

