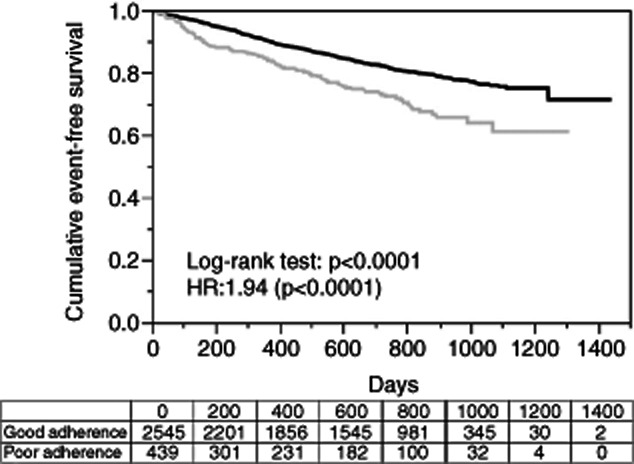
Figure 2.

Comparison of cumulative event-free survival rate by treatment adherence status. Cumulative event-free survival rates were estimated for the good adherence and poor adherence groups using the Kaplan–Meier method, and are shown along with the number of patients at risk. Two curves were compared by log–rank test, and hazard ratio (HR) was calculated by Cox proportional hazards model. ( ) Good adherence; (
 ) poor adherence.
