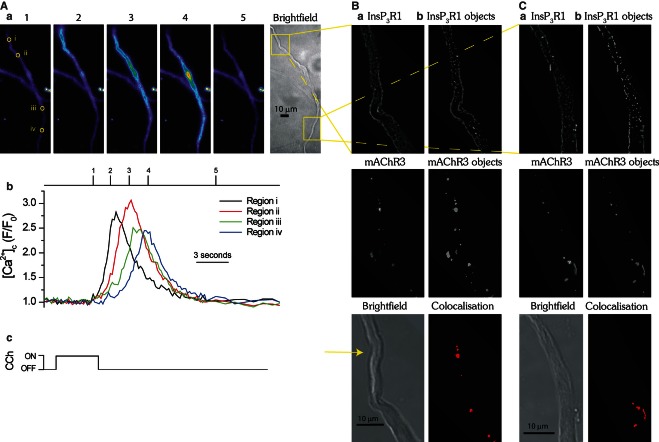
Figure 1.
The colocalization of InsP3R1 and mAChR3 at sites of Ca2+ wave initiation. Carbachol (CCh, 4 s; Ac) evoked a Ca2+ wave (Aa, Ab) which initiated from a single site in a single colonic myocyte (Aa; frame 1, region i) and propagated from there. The Ca2+ wave repeatedly initiated from the same site during subsequent carbachol applications (data not shown). The extent of IP3R1 and mAChR3 colocalization was next assessed in the same cell at the site of Ca2+ wave initiation and compared to another separate region of the cell (Aa; yellow boxes on bright field image). The cell was fixed, prepared for immunocytochemistry, labeled with IP3R1 monoclonal and mAChR3 polyclonal antibodies, and visualized by confocal microscopy using a fluorescently conjugated secondary antibody (Ba, Ca; top and middle panels). Colocalization was quantified using image analysis software ImageJ 65 and the plugin JACoP to examine object-based colocalization. Colocalization of the center of mass of three dimensional IP3R1 and mAChR3 objects created using the 3D object counter plugin (Bb, Cb; top and middle panels) were quantified by determining the number of centers from one image that were colocalized with objects from the other image (Bb, Cb; bottom panel). In the above experiment, 9.0% of the objects colocalized (9 out of 100 objects detected) at the initiation site and 4.6% colocalized (7 out of 152 objects detected) at the other site. The images shown are from plane 45 of 70 (B; initiation site) and plane 34 of 50 (C; same cell, other site) plane z stacks, each image taken at 150 nm intervals. Brightfield image (Ba, Ca; lower panel) of the same cell; initiation site indicated (Ba; yellow arrow). Note: Scale bar at bottom of bright field images. The images acquired using confocal microscopy (B,C) were rotated for clarity to match the orientation of the images acquired using epifluorescence microscopy (A). From Olson et al. 60 with permission.

