
Figure 3.
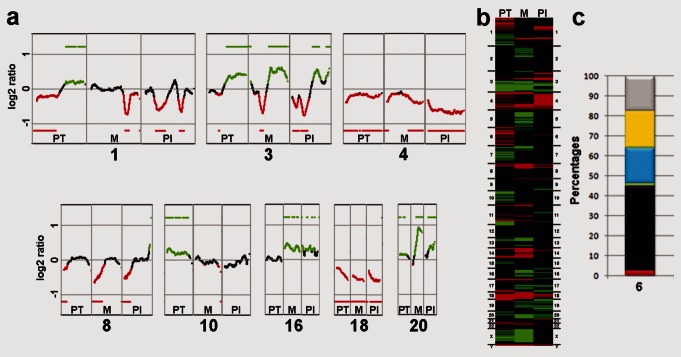
Comparison of copy number changes in the primary tumor, metastasis and plasma DNA of Patient #6. (a) Comparison of the ratio profiles of representative chromosomes (1, 3, 4, 8, 10, 16, 18 and 20; indicated by numbers below the copy number changes) between the primary tumor (PT, left column), metastasis (M, center column) and plasma DNA (Pl, right column). The single green and red bars summarize the regions that were gained or lost based on all iterative calculations of our algorithm (Supporting Information). The black profile regions represent balanced regions, lost regions appear in red and gained regions are shown as green (complete profiles are depicted in Supporting Information Fig. 1a). (b) Heat maps comparing the copy number changes in the primary tumor (PT), metastasis (M), and plasma DNA (Pl; Black: balanced regions; red: under-represented regions; green: over-represented regions). (c) The bar chart combines information on copy number changes and their occurrence in the primary tumor, metastasis and plasma DNA. It displays the percentages of chromosomal regions that were commonly lost (red), balanced (black) or gained (green) in all three samples, shared by metastasis and plasma DNA only (blue), shared by primary tumor and plasma DNA only (yellow) or unique to the plasma DNA (gray).