
Figure 3.
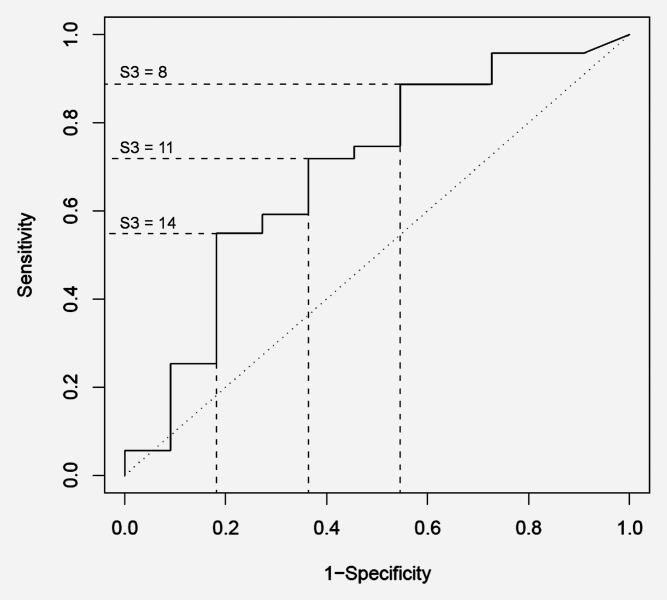
ROC curve resulting from application of classifier S3 to separate women positive for HPV16 DNA only at baseline from women positive at both time points. AUC = 0.69, χ2 = 2.7 (p = 0.10). Selected sensitivity and specificity points with corresponding S3 scores are shown. The sensitivity and 1-specificity values range from 0 to 1 and these correspond to percentages of 0% to 100% respectively.