FIGURE 3.
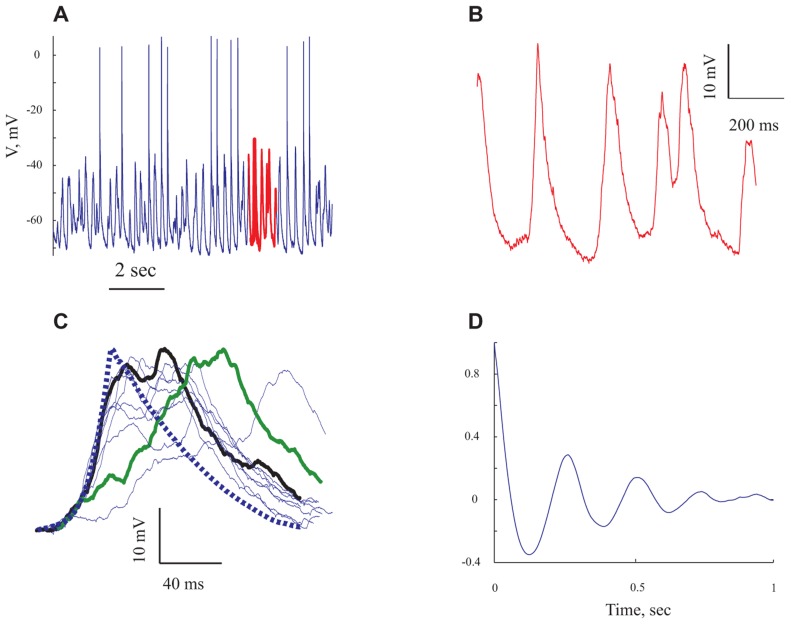
The rhythmic subthreshold spontaneous activity is composed of individual gigantic synaptic potentials that appear at different degrees of synchrony. (A) A 10 s long voltage trace recorded at resting potential. (B) Expansion of the section marked in red in (A). (C) The giant synaptic potential (GSP) time course. Thin lines denote single GPSs, thick blue line denotes an average of 247 GSPs. Thick green line denotes an example of a "staircase"-like GSP. The thick black line is an example of a GSP with a similar rise time to that of the average GPS. (D) An autocorrelogram of the voltage trace shown in (A) All panels refer to data from the same cell.

