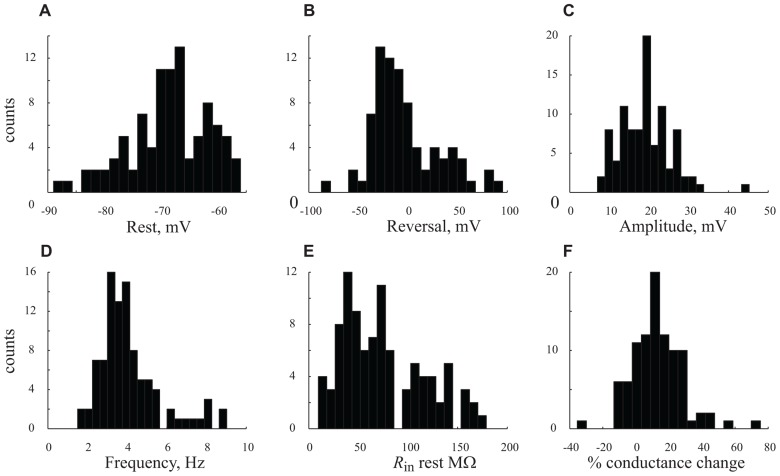
FIGURE 5.
Distribution the cells’ characteristics. (A–F). Histograms denote results obtained from all n = 56 cells under control conditions (A) resting potential. (B) GSP reversal potential. (C) GSP amplitude. (D) GPS frequency. (E) Rin at resting potential. (F) Percentage (%) of conductance change between resting potential and peak of GSP. Note the unimodal distributions of all the parameters.

