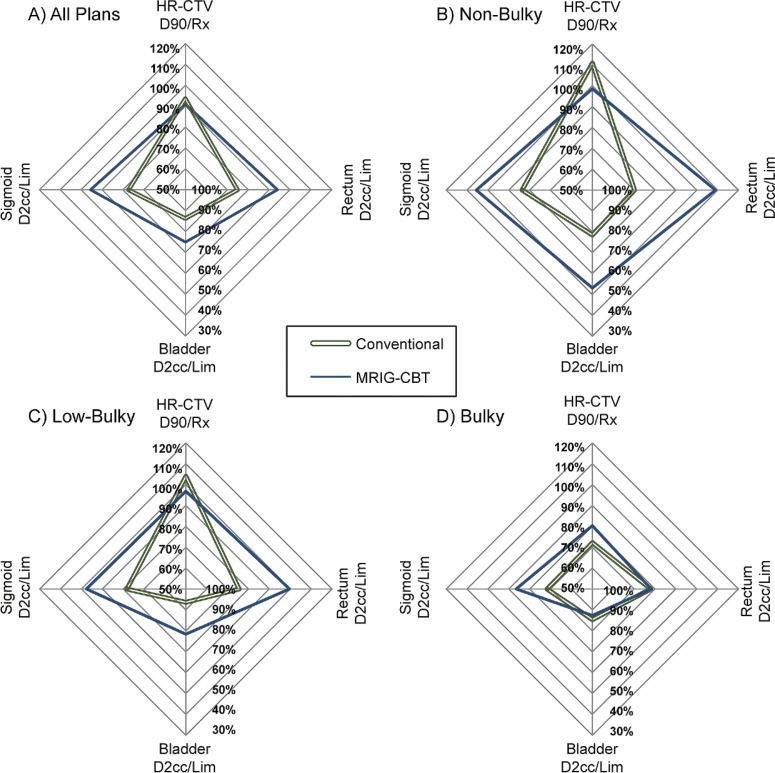
Fig. 2.
Average plan attributes for each HR-CTV size. HR-CTV D90 is plotted on the vertical axis relative to the prescription dose. Therefore, the 100% of HR-CTV D90/prescription dose (Rx) represents HR-CTV D90 receives Rx. The D2cc of each OAR relative to the OAR limit (D2cc/Lim) is plotted on the other three axes, thus smaller % values represent better OAR sparing; these axes are inverted such that OAR sparing increased as the values of sigmoid, bladder, rectum move away from the origin

