
Table 1.
Percentage of physically and socially causal attributions, in 4 age groups, for launch events with contact and reaction events without, each involving rigid, inanimate, or non-rigid, animate motion in Experiment 1.
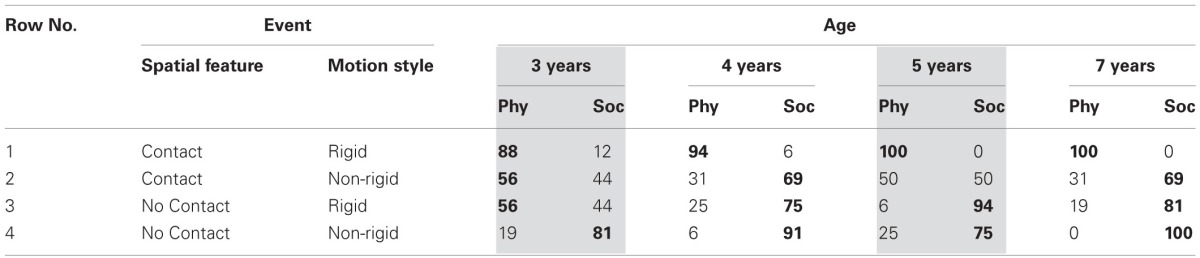
Modal values in bold.
Official websites use .gov
A
.gov website belongs to an official
government organization in the United States.
Secure .gov websites use HTTPS
A lock (
) or https:// means you've safely
connected to the .gov website. Share sensitive
information only on official, secure websites.
Percentage of physically and socially causal attributions, in 4 age groups, for launch events with contact and reaction events without, each involving rigid, inanimate, or non-rigid, animate motion in Experiment 1.
Modal values in bold.