Table 3.
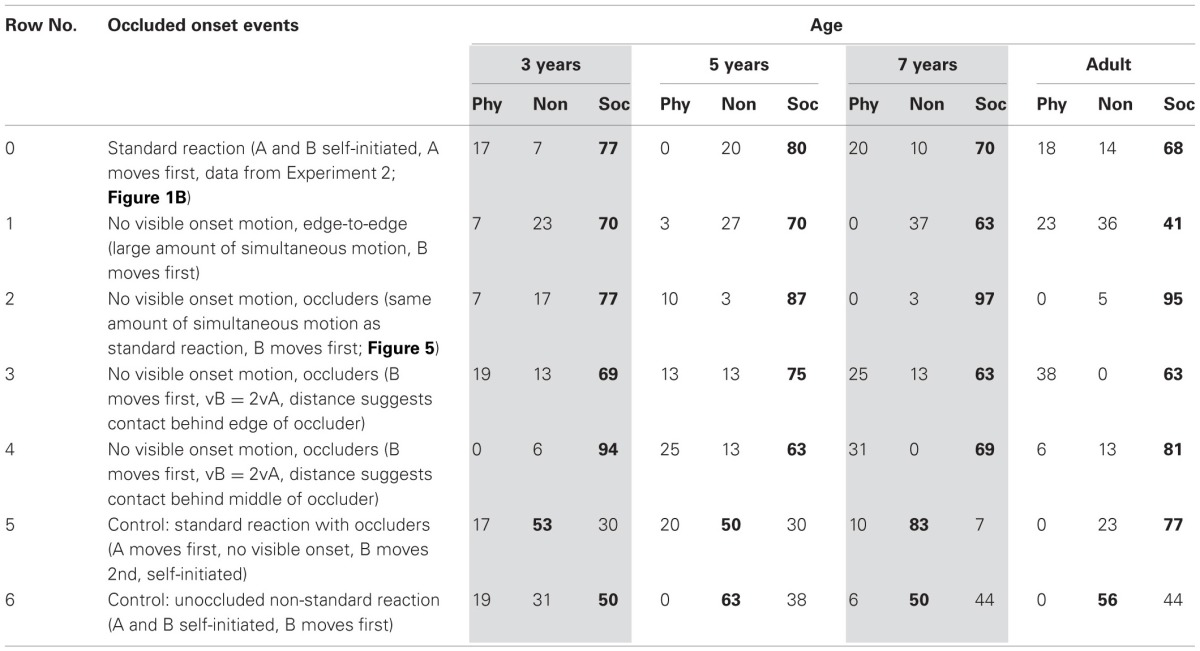
Percentage of physically causal, non-causal, and socially causal attributions, in 4 age groups, for 4 events showing motion-at-a-distance without visible motion onset, and for 3 other events in Experiment 3.

Modal values in bold.
Percentage of physically causal, non-causal, and socially causal attributions, in 4 age groups, for 4 events showing motion-at-a-distance without visible motion onset, and for 3 other events in Experiment 3.

Modal values in bold.