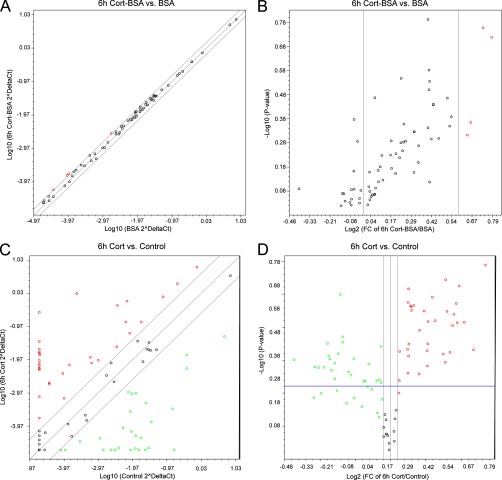
Fig. 2.
Cort-BSA stimulation does not induce transcription by common signaling pathways. CCRF-CEM cells were stimulated with 3 μg/ml Cort-BSA (Group 1) or BSA (Control group) for 6 h and Human Signal Transduction Pathway Finder RT2 Profiler™ PCR Arrays (Qiagen) were performed in biological triplicates and graphical representations were generated by RT2 Profiler™ PCR Array Data Analysis V3.4. The scatter plot of the 84 genes investigated (left panel) show no changes in gene expression and the volcano plot (right panel) shows the range of p values obtained.

