
Fig. 4.
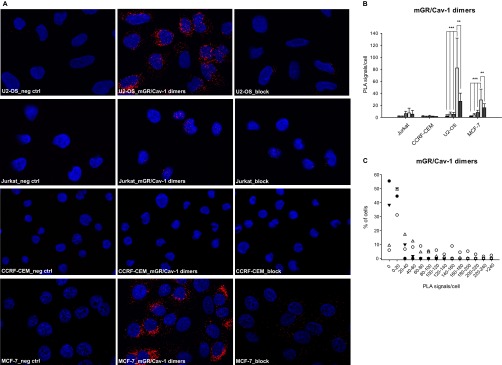
mGR and Cav-1 heterodimers detection by in situ Proximity Ligation Assay.
A, Representative microscopy pictures of mGR/Cav-1 heterodimers detection by in situ PLA in CCRF-CEM, Jurkat, U2-OS and MCF-7 cells. Control conditions includes: no primary antibody (neg ctrl), no GR antibody (Cav-1 only), no Cav-1 antibody (M20 only), or blocking the anti-GR primary antibody with its cognate peptide “block.” B, The average number of mGR/Cav-1 heterodimers, expressed in PLA signals per cell, in CCRF-CEM, Jurkat, U2-OS and MCF-7 cells is summarized.  = Neg control;
  = Cav-1 ab only;
  = GR ab only;
  = GR/Cav-1 dimers;
  = block. C, PLA signals were counted for each cell line and the distribution of the signal over the population of cells is shown for the four cell lines tested. ● = CCRF-CEM cells; ○ = U2-OS cells; ▾ = Jurkat cells; △ = MCF-7 cells. * p < 0.05, ** p < 0.01, *** p < 0.005.