
Fig. 6.
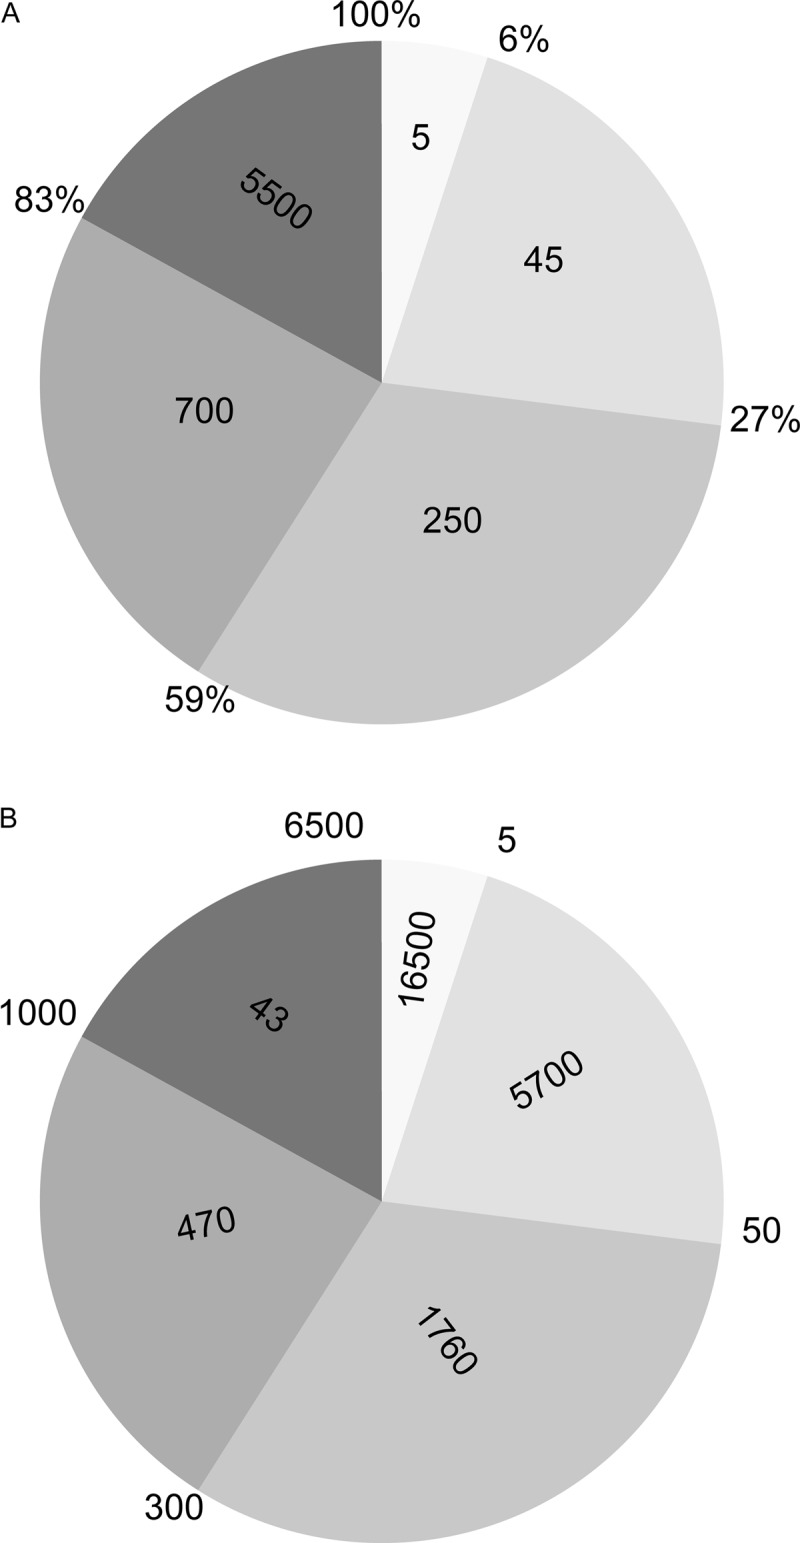
Occupation of the ligandome. The intensity distribution of peptides constituting the ligandome is shown for B-LCL JYpp65. A, the outer rim of the pie chart displays the percentage occupation of the HLA ligandome, and the number within each pie segment is the number of unique peptides in that segment. Of the total number of 6500 identified peptides, the top five abundant proteins occupy 6% of all HLA molecules, the top 50 abundant peptides occupy 27% of all HLA molecules, etc. Note that the lowest abundant 5500 peptides occupy only 17% of all HLA molecules. B, the numbers in panel A have been converted to copy numbers (i.e. the number of ligands per cell). The outer rim of the pie chart displays the number of unique peptides, and the number within each pie segment is the average copy number for the peptides in that segment. The top five abundant peptides are on average present with 16,500 copies on the cell surface, peptides 5–50 are on average present with 5700 copies, etc. The average copy number of the lower abundant peptides is 43; the very low abundant peptides are present at copy numbers close to 1 or even less.