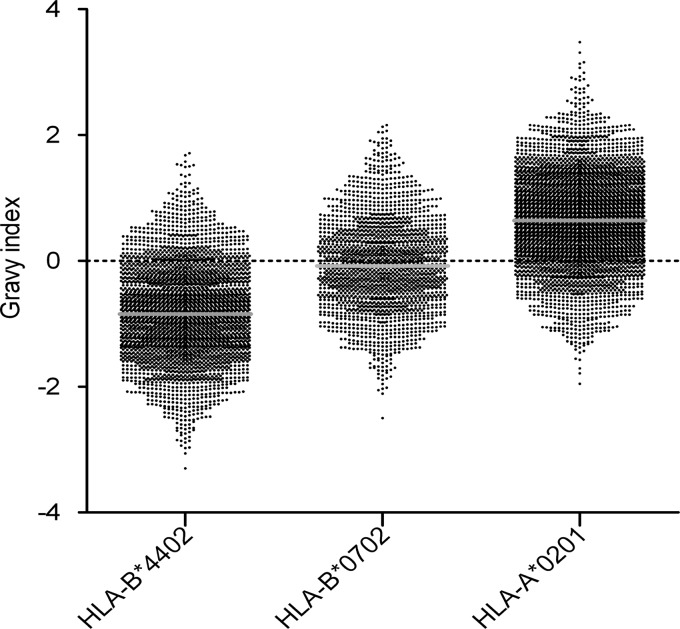
Fig. 9.
Allele-specific distribution of HLA peptides over the hydrophobicity range. These plots show a clear average hydrophobicity shift going from HLA-B44 (most hydrophilic, median GRAVY index of −0.84) to HLA-B7 (median GRAVY index of −0.08) to HLA-A2 (median GRAVY index of 0.64). The positions of the three distributions are as expected and illustrate the overall quality of our dataset.

