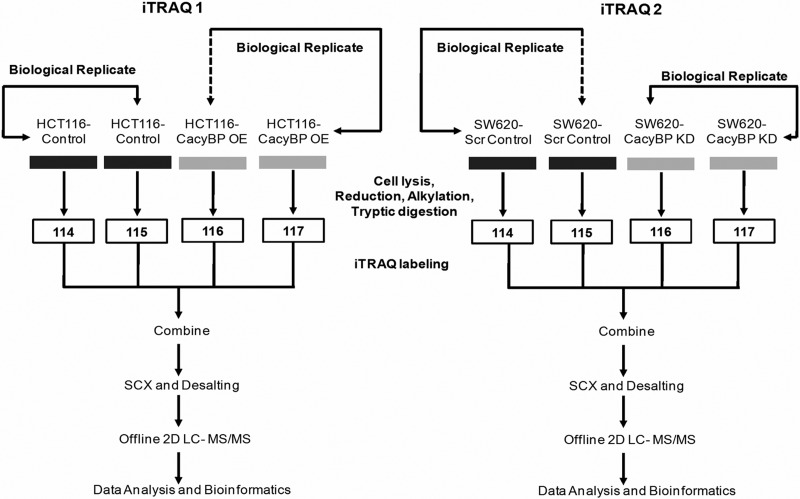
Fig. 1.
Schematic representation of the experimental design for iTRAQ labeling showing biological replicates. In iTRAQ1, two biological replicates from HCT116-Control cells were labeled with 114 and 115 respectively, and from HCT116-CacyBP OE cells were labeled with 116 and 117 respectively. In iTRAQ2, two biological replicates from SW620-Scr Control cells were labeled with 114 and 115 respectively, and from SW620-CacyBP KD cells were labeled with 116 and 117 respectively.

