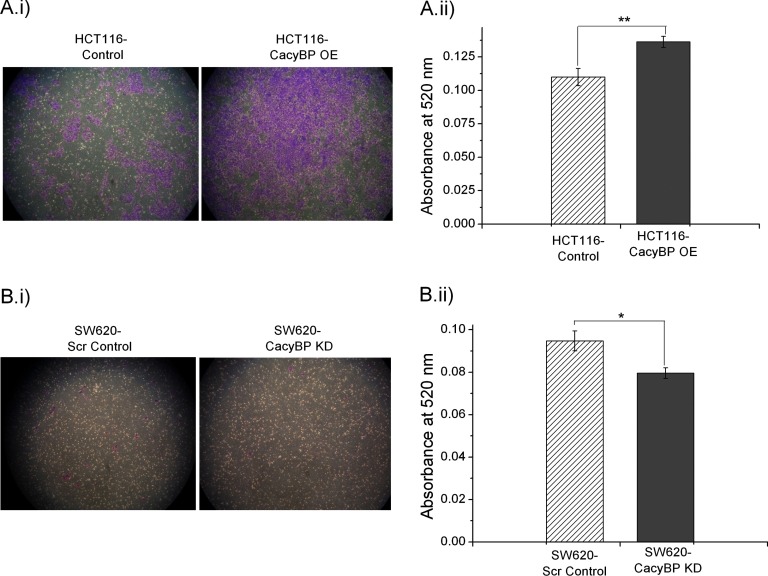
Fig. 5.
CacyBP affects cell migration. A, Cell migration was increased in HCT116-CacyBP OE cells compared with HCT116-Control cells. B, Decreased cell migration was observed in SW620-CacyBP KD cells as compared with SW620-Scr Control cells. Quantitation values for cell migration was presented as mean ± S.E. (n = 10) based on three independent experiments where * indicates p < 0.05 and ** indicates p < 0.001 using two tailed unpaired t test.

