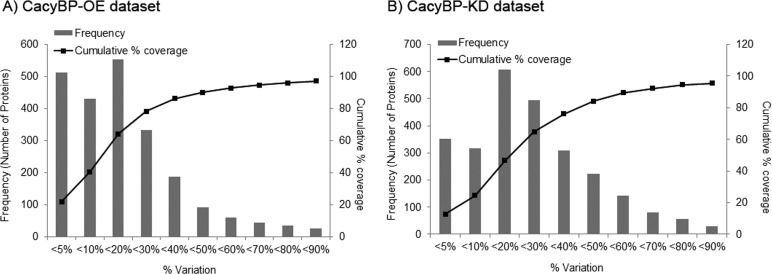
Fig. 7.
Determination of experimental variation using all the identified proteins (Unused score > 1. 3) common in both biological replicates: The horizontal axis represents % variation of iTRAQ ratios of same protein from different biological replicate samples from 1. The primary vertical axis represents the corresponding number of proteins (bars) having different % variation. The secondary vertical axis represents the cumulative % of the counted proteins (lines). Variation against 88% coverage of population was considered for selecting cut-off. A, Corresponds to CacyBP-OE data set and B, Corresponds to CacyBP-KD data set.

