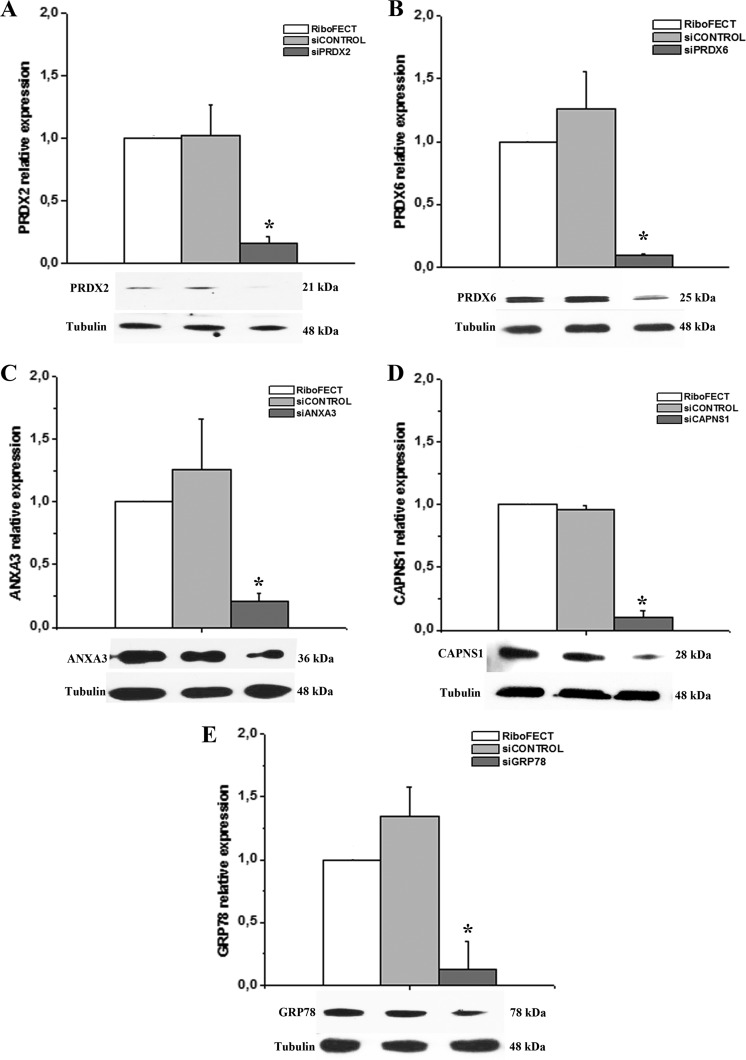
Fig. 4.
Quantitative RT-PCR and Western blotting analysis of selected caveolar raft-enriched proteins following siRNA treatment. Real time PCR showing gene expression levels before and after ECFCs treatment with specific siRNA to CAPNS1, PRDX2, PRDX6, ANXA3, GRP78. RiboFECT: ECFCs treated with transfection reagents alone; siCONTROL: ECFCs treated with a not-inhibiting RNA; siRNA: siRNA treatment for each specific gene. Data shown are the mean of three different experiments performed in triplicate. The two-tailed, non-paired Student's t test was performed. * indicates a p value < 0.05. Under each histogram the Western blotting of the protein is shown. Each blotting represents a typical experiment out of three that gave similar results.

