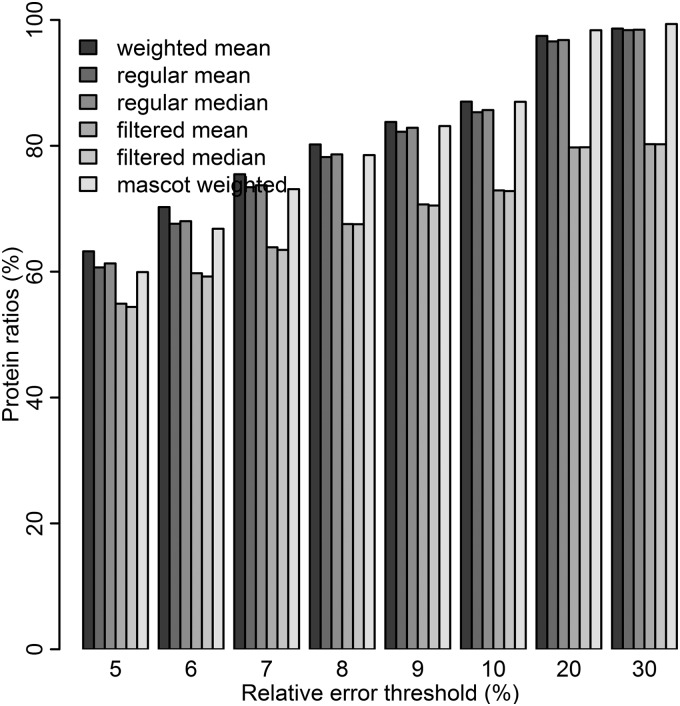
Fig. 5.
Comparison of methods to calculate protein quantities based on peptides. The bars represent percentage of protein ratios passing different relative error thresholds, for weighted protein mean, regular protein mean/median, filtered protein mean/median, and Mascot weighted protein mean. Proteins with one peptide are excluded from the comparison because weighting will not affect those proteins.

