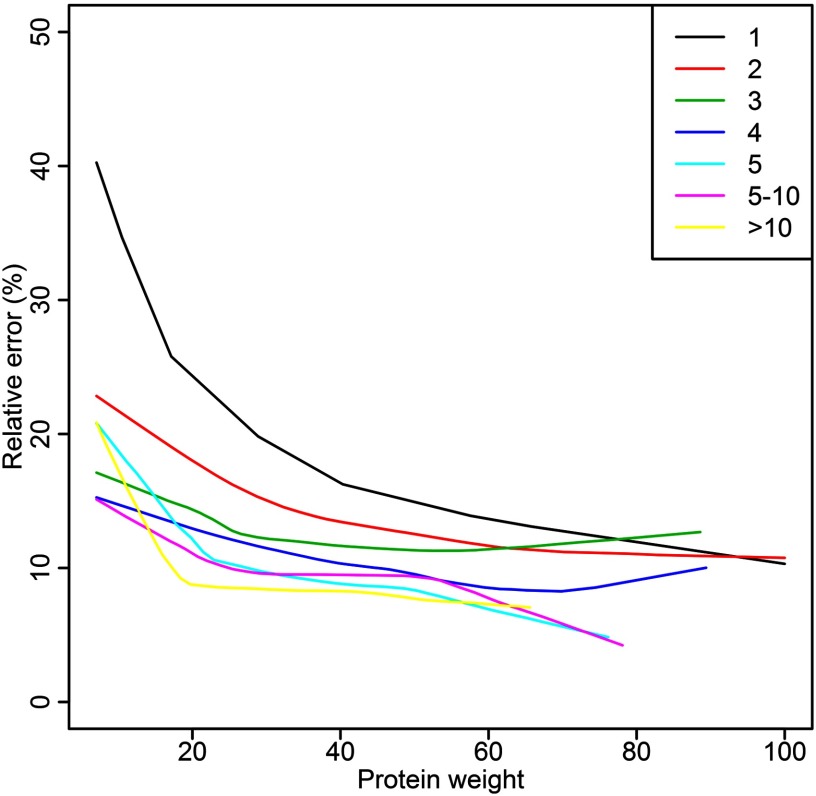
Fig. 6.
Impact of the number of peptides per protein on quantification. The relative error of weighted protein quantity in percentage is plotted against protein weight for proteins with different number of peptides. The figure is based on Orbitrap data using 400 μg loaded peptide amount and prefractionation by IPG-IEF. Lines represent smoothed 95% upper limit of relative error, see Fig. 2 for definition. The protein weight is calculated as the mean of peptide weights.

