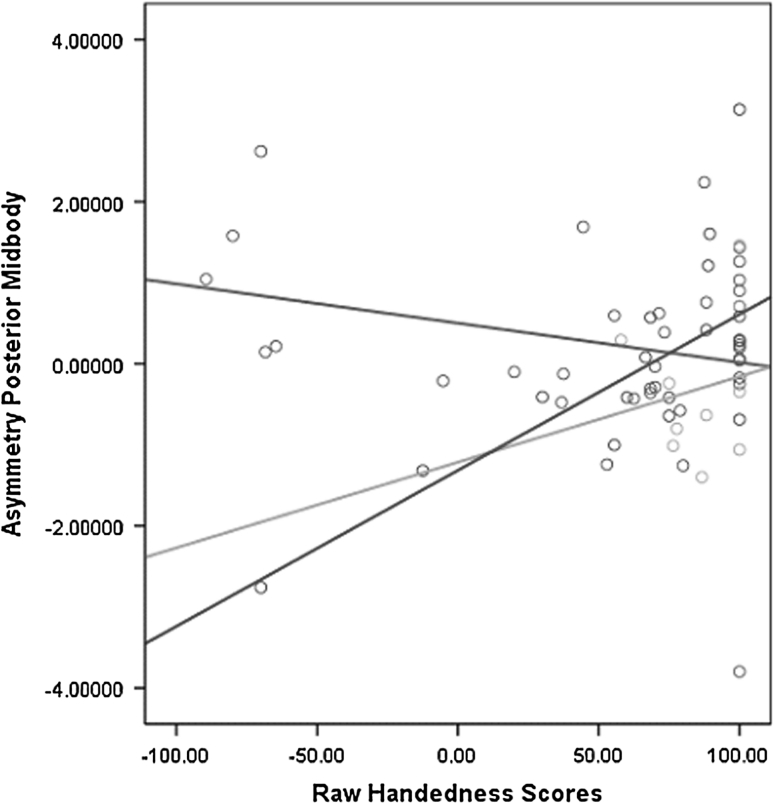
Fig. 3.
Asymmetry of the posterior midbody in standardized residual units (with age regressed out) in relation to handedness across the three groups. Values >0 indicate rightward asymmetry and values <0 indicate leftward asymmetry. Blue line ASC, red line siblings and green line controls (Color figure online)

