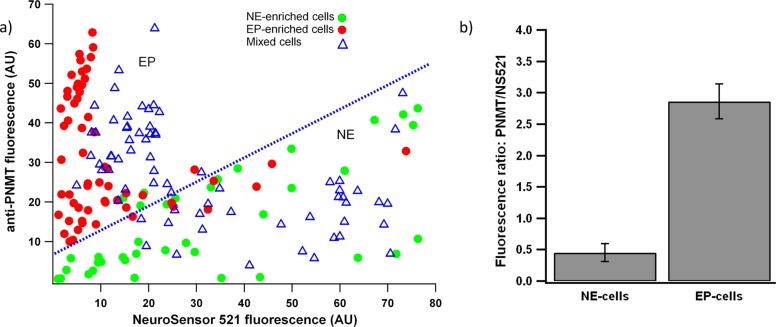
Figure 5.
Quantification of cell fluorescence from the cell populations from Figure 4. (a) Fluorescence intensity at 585 nm plotted on the Y-axis and fluorescence intensity at 525 nm plotted on the X-axis. Each point represents an individual cell. EP-enriched cells fall above the blue line, and NE-enriched cells fall below the blue line. (b) The average ratio of fluorescence intensity at 585 nm vs 525 for norepinephrine-enriched and epinephrine-enriched cells.

