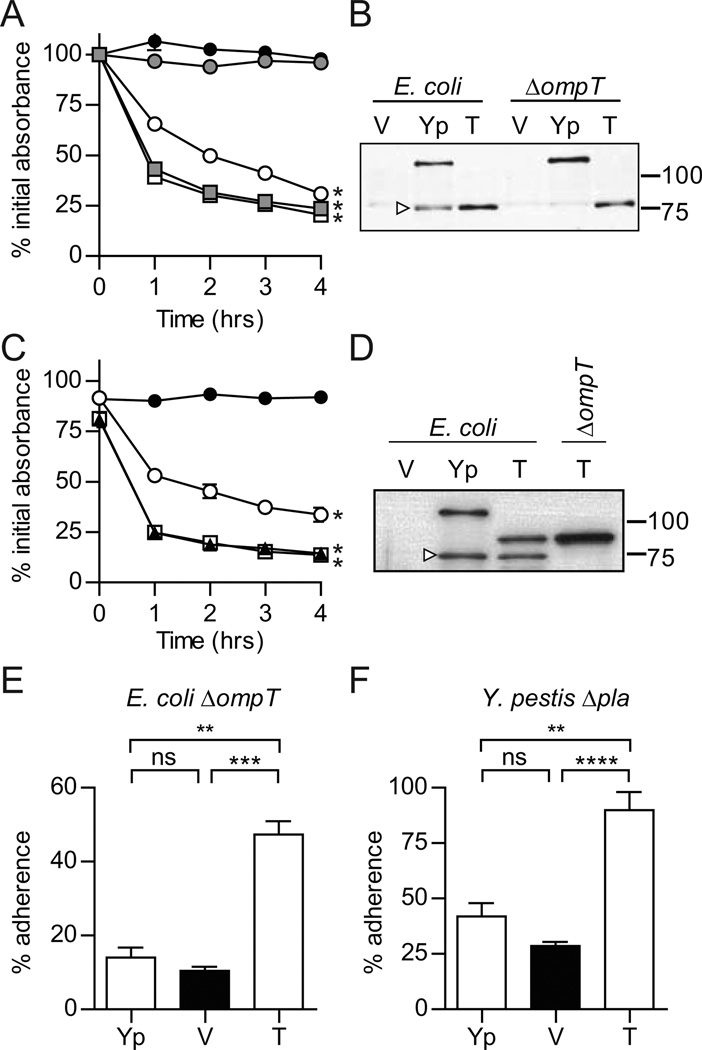
Figure 5. Analysis of adherence by truncated YapE.
Y. pestis YapE proteins lacking the N-terminal portions of the passenger domain were expressed in E. coli and Y. pestis omptin mutants to determine if the truncated proteins could restore adherence. (A) Settling assays with WT and ΔompT E. coli expressing YapEΔ34-337. ● = WT E. coli, vector only (pMWO-034); ○ = WT E. coli, Y. pestis YapE (pMBL313);  = ΔompT, Y. pestis YapE (pMBL313); □ = WT E. coli, YapEΔ34-337 (pLOU059);
  = ΔompT, YapEΔ34-337 (pLOU059). YapE expression was induced for 2 hrs and then samples were harvest from static cultures at a specific depth at 1 hr intervals. The absorbance (OD600) of these samples were determined and compared to the OD600 at T=0. Three independent biological replicates were performed for each bacterial strain and each assay was repeated three times (n=9). Each symbol represents the mean percent initial absorbance ± the standard deviation; * = P≤0.0001 (B) Western blot of YapE proteins from A. V = vector control; Yp = Y. pestis YapE; T = YapEΔ34-337. White arrowhead indicates OmpT cleavage site. (C) Settling assays (performed as described in A) with WT and ΔompT E. coli expressing YapEΔ34-236. ● = WT E. coli, vector only (pMWO-034); ○ = WT E. coli, Y. pestis YapE (pMBL313); □ = WT E. coli, YapEΔ34-236 (pLOU109); ▲ = ΔompT, YapEΔ34-236 (pLOU109). * = P≤0.0001. (D) Western blot of YapE proteins from C. V = vector control; Yp = Y. pestis YapE; T = YapEΔ34-236. White arrowhead indicates OmpT cleavage site. (E and F) Adherence assays with E. coli ΔompT (E) or Y. pestis Δpla (F) expressing truncated YapE. Yp = Y. pestis YapE (pMBL313); V = vector control (pMWO-034); T = truncated YapE (YapEΔ34-337 [pLOU059] or YapEΔ34-236 [pLOU109] for E and F, respectively). Fold adherence was calculated as the number of cell-associated cfu divided by total cfu from a separate tissue culture well. Three independent biological replicates were performed for each adherence assay and each assay was repeated three times (n=9). Each bar represents the mean percent adherence ± the standard deviation; ** = P≤0.002; *** = P≤0.0006; **** = P≤0.0001.

