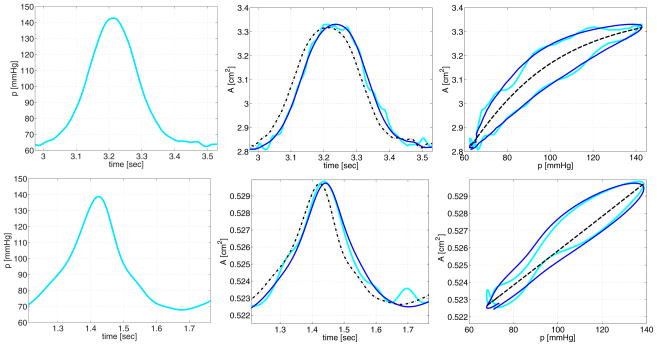
Fig. 6.
Illustration of the model parameters estimation routine to predict area dynamics using ovine data obtained under ex vivo experimental conditions. The top row shows time varying pressure and area and dynamics for the thoracic descending aorta using the sigmoid model and the bottom row shows similar graphs for the carotid artery using the Kelvin model. The black dashed lines show estimates obtained with the elastic response of the respective model, and the solid dark lines show estimates obtained with the full viscoelastic model. The light grey line is the observed data.

