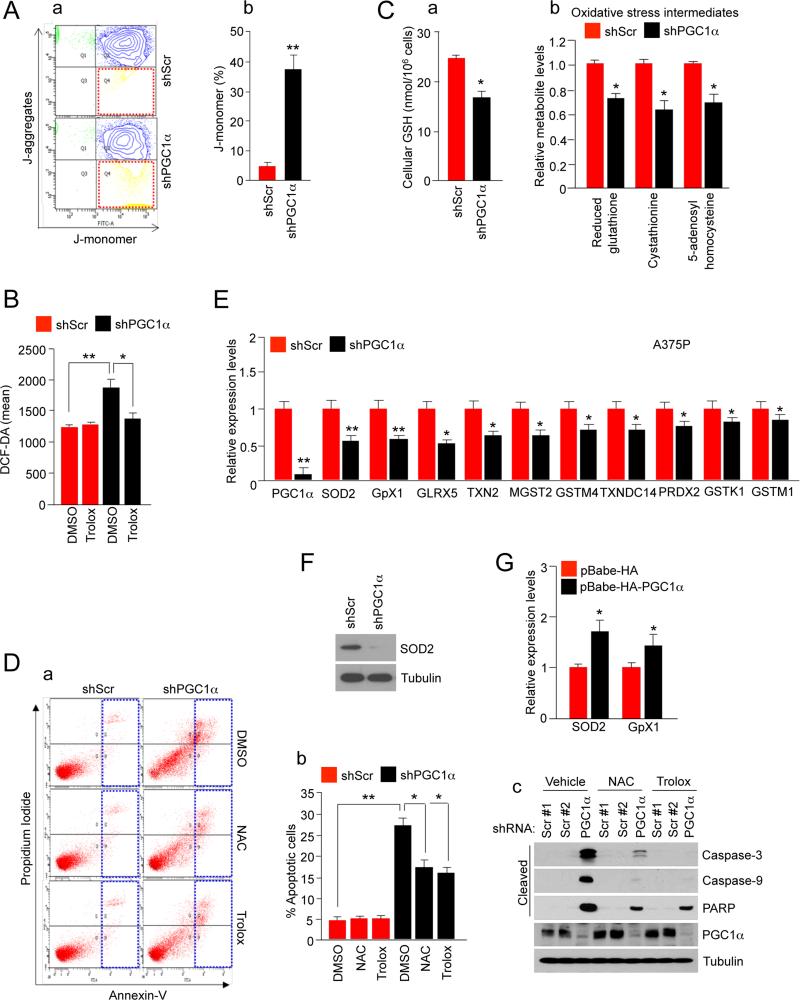
Figure 5. Depletion of PGC1α Triggers an Increase in ROS Levels Causing Apoptosis.
(A) (a) Mitochondrial membrane potential measured by the JC-1 dye in PGC1α knocked-down and control A375P cells. (b) Quantitation of the percentage of J-monomer. Values on the graph represent mean ± SD of three independent experiments performed in duplicate. **p < 0.01.
(B) ROS levels in control and PGC1α knock-down A375P cells measured using the DCF-DA dye. Values represent mean ± SD of three independent experiments performed in triplicate. *p < 0.05 and **p < 0.01.
(C) (a) Total GSH levels and (b) oxidative stress intermediates in PGC1α knocked-down and control A375P cells. Values represent mean ± SD of three independent experiments performed in triplicate. *p < 0.05.
(D) Analysis of apoptosis in A375P cells (control and PGC1α knocked-down) treated with 2 mM NAC or 100 μM Trolox for 2 days. (a) Annexin V diagram, (b) quantitation of the percentage of apoptotic cells using the Annexin V assay and (c) western blot analysis of caspases and PARP cleavages. Values on the graph represent mean ± SD three independent experiments performed in triplicate. *p < 0.05 and **p < 0.01.
(E) mRNA expression levels of ROS detoxification genes in PGC1α knock-down A375P melanoma cells. Values represent mean ± SD of three independent experiments performed in triplicate. *p < 0.05 and **p < 0.01.
(F) Western blot analysis of SOD2 protein levels in A375P cells.
(G) SOD2 and GpX1 mRNA levels after ectopic expression of PGC1α in A375 cells. Values represent mean ± SD of two independent experiments performed in triplicate. *p < 0.05.
See also Figure S5.

