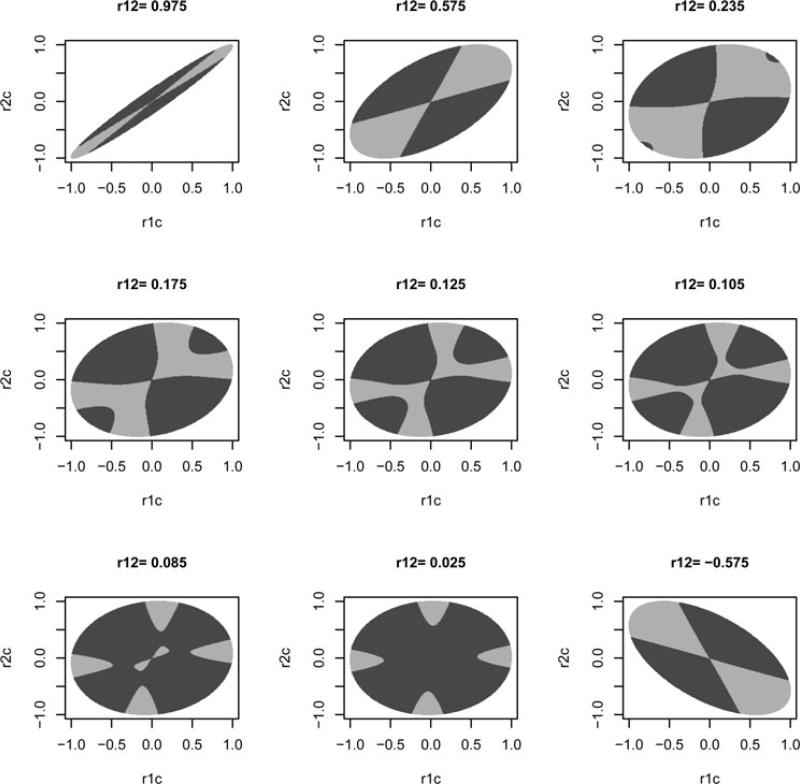
Fig. 2.
Power comparison of two-marker vs. single-marker tests and their relationship with the correlation space in the first simulation. Each plot has a fixed ρ12 (correlation between markers). The gray regions are the possible space of ρ1c and ρ2c (correlations between markers and causal SNPs) for a specific value of ρ12. The dark/light area indicates those correlation combinations where the two-marker test is more/less powerful than the single-marker test.

