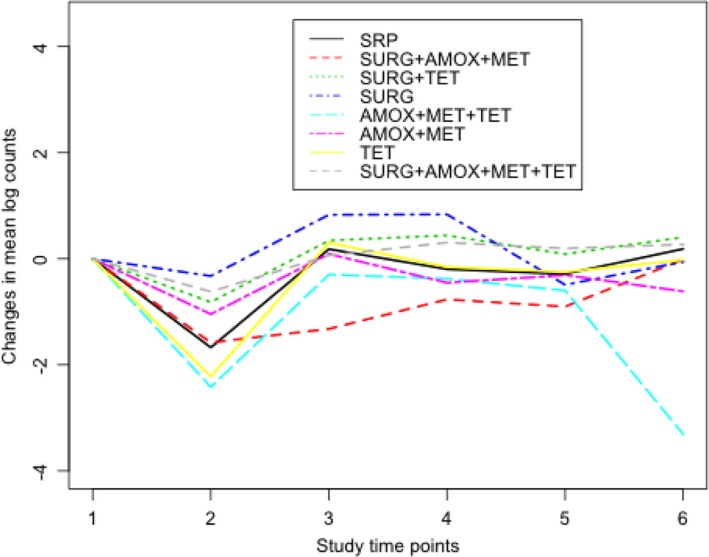
Fig. 2.
Changes in natural log counts of Actinomyces at each study time point from baseline. Study time points 1–6 correspond to baseline, 3, 6, 12, 18, and 24 months, respectively. Lower counts in all treatment groups can be seen at 3 months compared to baseline counts. Compared to the reference group SRP, subjects in the AMOX+MET+TET and TET groups had lesser counts between baseline and 3 months.

