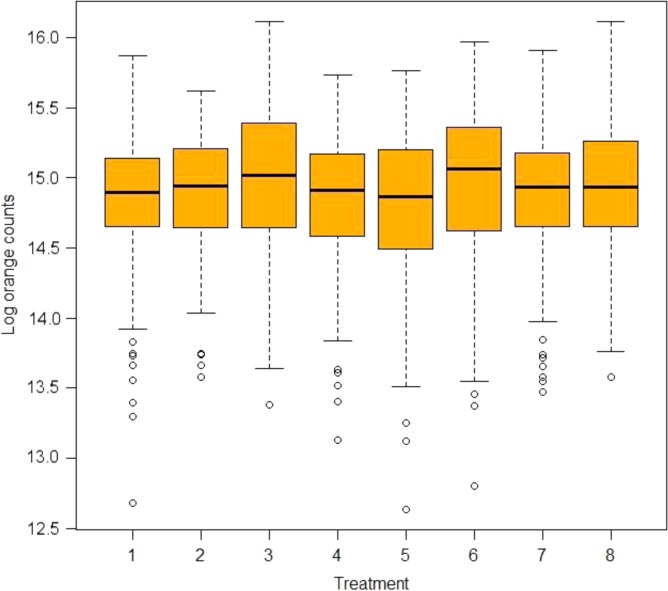
Fig. 5.
Box-plot showing the median distribution of orange complex counts by treatment at baseline. The treatments 1–8 are SRP, surgery (SURG)+AMOX+MET, SURG+TET, SURG, AMOX+MET+TET, AMOX+MET, TET, and SURG+AMOX+MET+TET, respectively. Again, minimal variations in the median distributions of the counts can be seen.

