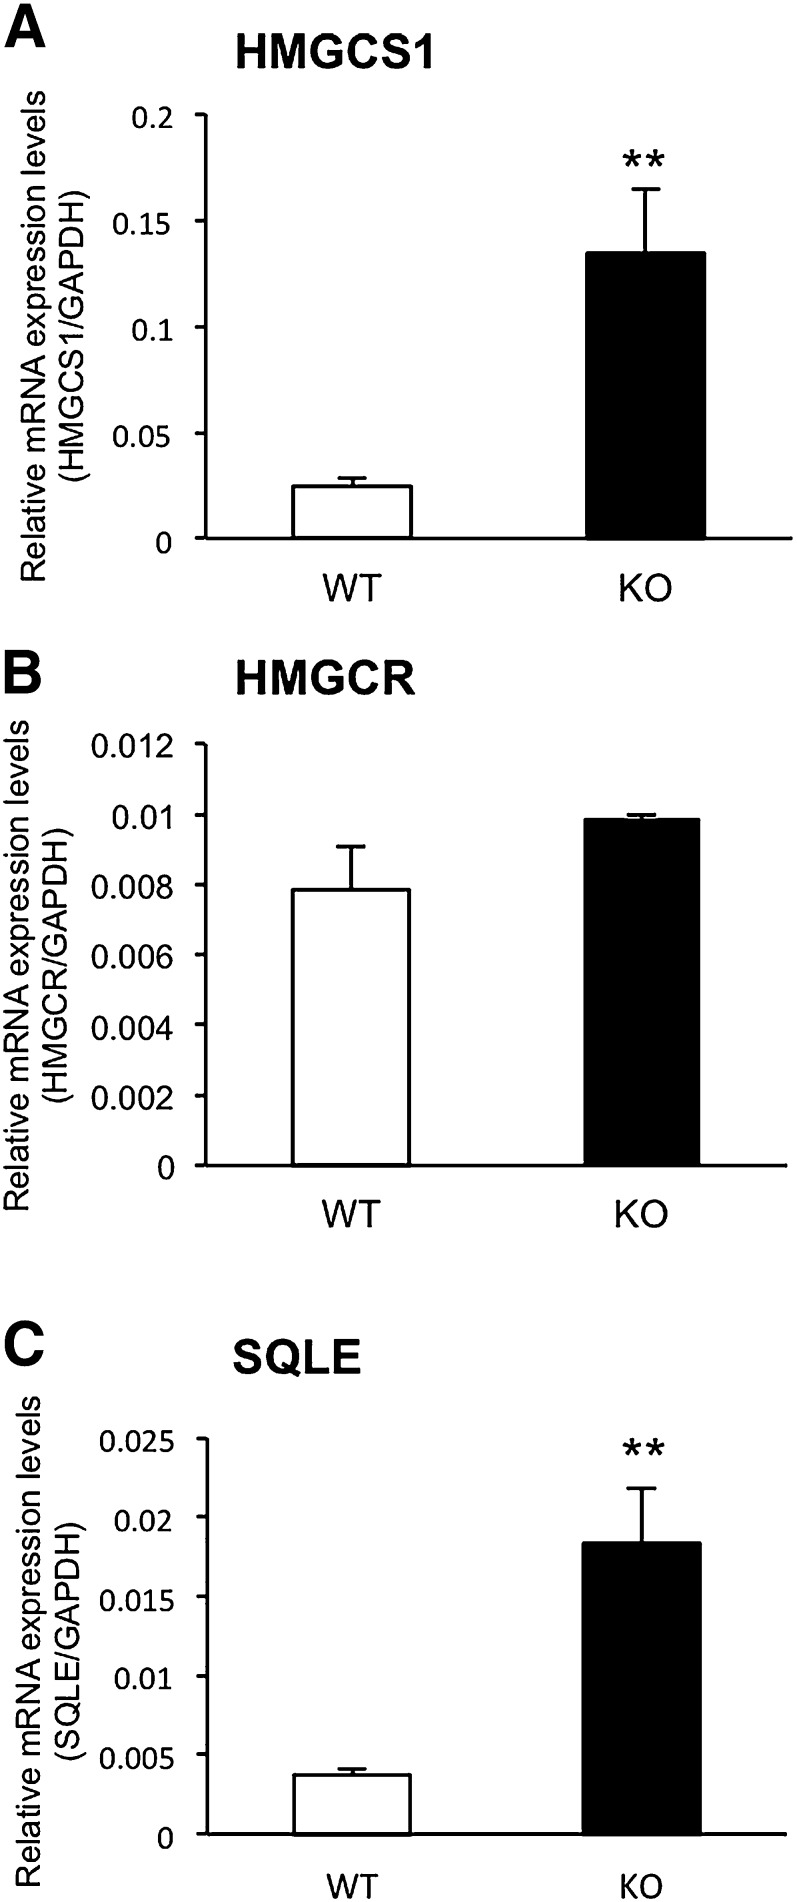
Fig. 1.
Expression levels of HMGCS1 (A), HMGCR (B), and SQLE (C) mRNAs in the livers of WT and Cyp3a−/− (KO) mice. Expression levels were normalized by expression levels of GAPDH and are shown as means ± SEM of six mice in each group. cDNAs prepared from each mouse were used for triplicate determination. **P < 0.01 versus WT mice.

