Fig. 1.
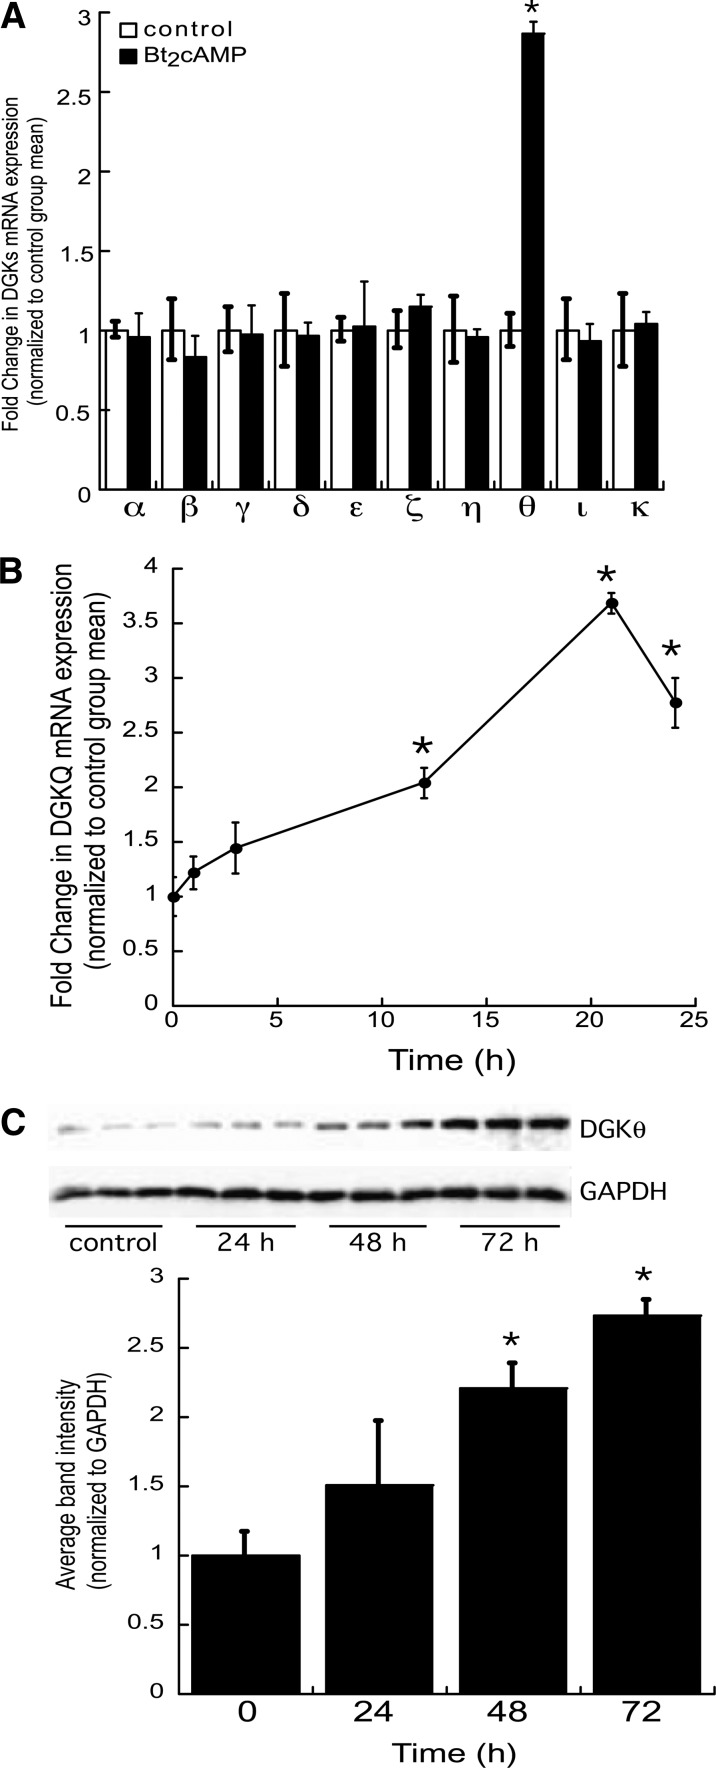
Bt2cAMP increases DGKθ mRNA and protein expression. A: H295R cells were cultured onto 12-well plates and treated for 24 h with 0.4 mM Bt2cAMP. Total RNA was isolated for analysis of DGK and β-actin mRNA expression by qRT-PCR. Data are graphed as fold change in DGK mRNA expression normalized to the mRNA expression of β-actin and represent the mean ± SEM of three separate experiments, each performed in triplicate. *Statistically different from untreated control group, P < 0.05. B: H285R cells were treated for 1–24 h with 0.4 mM Bt2cAMP and DGKθ mRNA expression quantified by real time RT-PCR. Data are graphed as fold change in DGKθ mRNA content and is normalized to the mRNA expression of β-actin. Shown is the mean ± SEM of three individual experiments, each performed in triplicate. Asterisk denotes statistically different from untreated control group, P < 0.05. C: H295R cells were cultured onto 6-well plates and incubated for 24–72 h with 0.4 mM Bt2cAMP. Whole cell lysates were harvested and analyzed by SDS-PAGE and Western blotting using anti-DGKθ antibody. Data graphed are densitometric analysis of Western blots of DGKθ protein expression in cells treated for 24–72 h with 0.4 mM Bt2cAMP. DGKθ protein expression normalized to GAPDH expression is graphed and represents the mean ± SEM of four separate experiments, each carried out in triplicate. Asterisks indicate a statistically significant difference compared with the untreated 0 h control group (P < 0.05).

