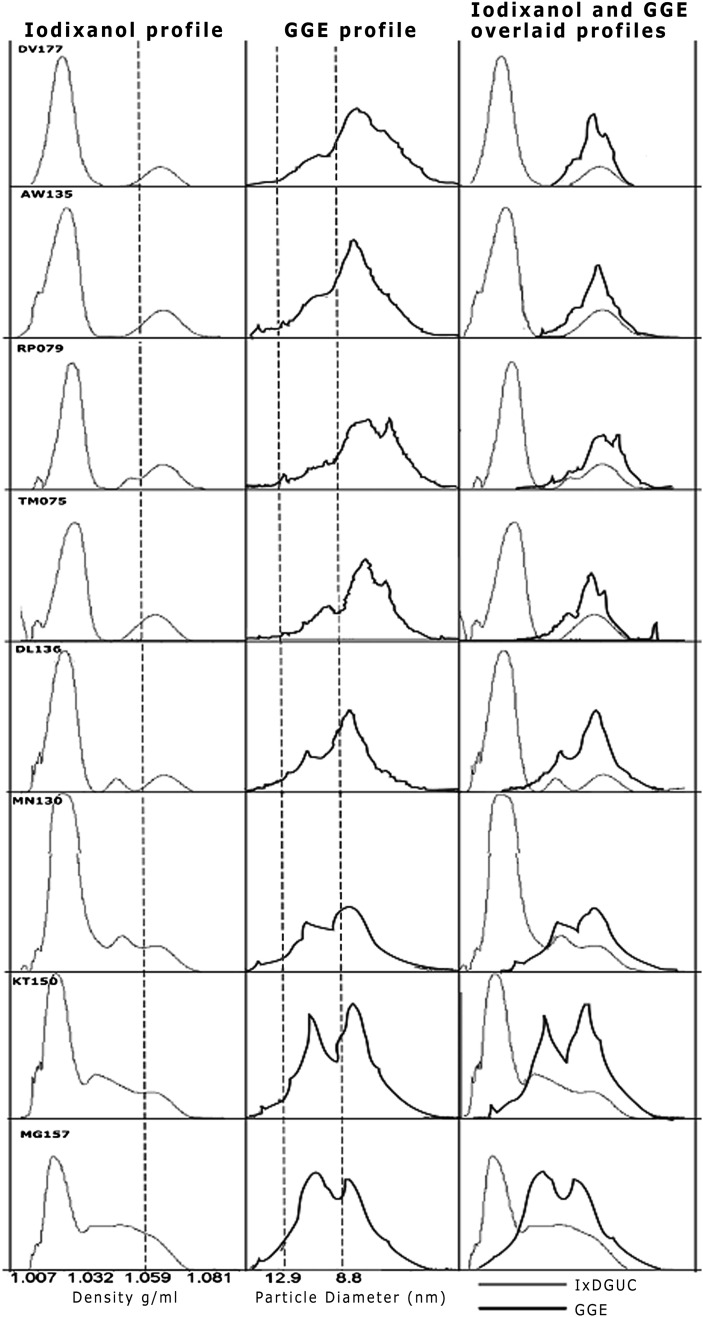
Fig. 3.
IxDGUC and GGE profiles for eight participants with varying total HDL-C. Density profiles from IxDGUC are shown on the left, and the center column shows GGE lipid-stained profiles for the same participants. Particle size was determined using a set of protein standards of known molecular mass and diameter to calibrate the gel. The column on the right depicts overlaid IxDGUC and GGE profiles.

