Fig. 3.
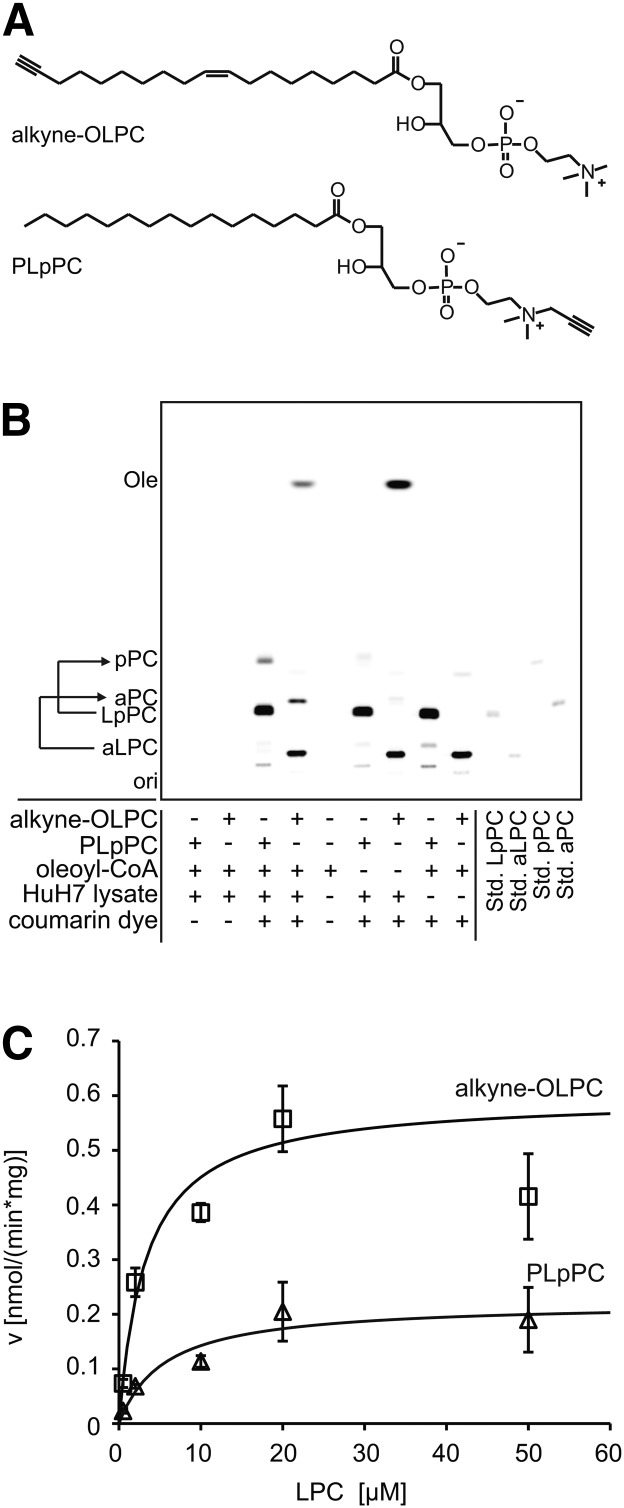
LPCAT assay using alkyne-OLPC or PLpPC. A: Structures of the substrates alkyne-OLPC (acyl chain-labeled) and PLpPC (headgroup-labeled). B: Fluorescent image of a TLC that shows a LPCAT assay using either alkyne-OLPC or PLpPC, oleoyl-CoA, and HuH7 cell lysate. For simplicity of the labeling of the TLC plate, we used aPC and aLPC for fatty acid-labeled PC and LPC, respectively, and pPC and LpPC for the headgroup-labeled analogs. Products were identified using comigrating synthetic standards (Std.). “ori” depicts the origin of the TLC. For assay details, see Materials and Methods. C: Michaelis-Menten kinetics measured for alkyne-OLPC (squares) and PLpPC (triangles). Line graphs show the reaction rate (v) calculated with the Michaelis-Menten equation using the values for Vmax and Km obtained by nonlinear regression fitting. Data are mean ± SD of triplicate determinations.

