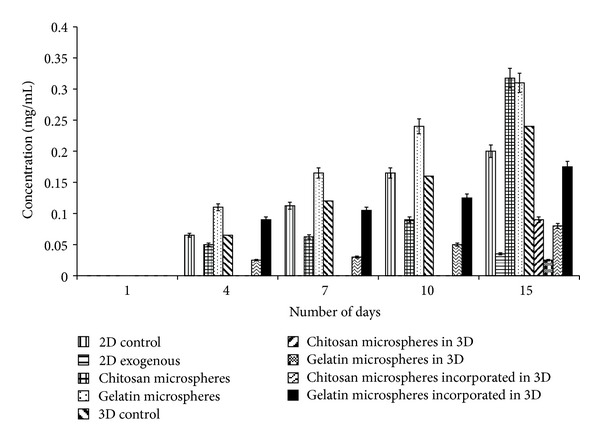
Figure 7.

Estimation of glutamate concentration by HPLC was done. It was analyzed both in control (2-D and 3-D) as well as α-KG containing samples wherein α-KG was delivered in the following three different ways: (i) exogenously in free form in 2-D, (ii) chitosan or gelatin microspheres containing α-KG in both 2-D and 3-D system, and (iii) α-KG containing chitosan or gelatin microspheres incorporated in the synthesized chitosan-gelatin-polypyrrole cryogel. All the experiments were performed in triplicates, and the Student's-t test was performed to obtain the P value. P < 0.05.
