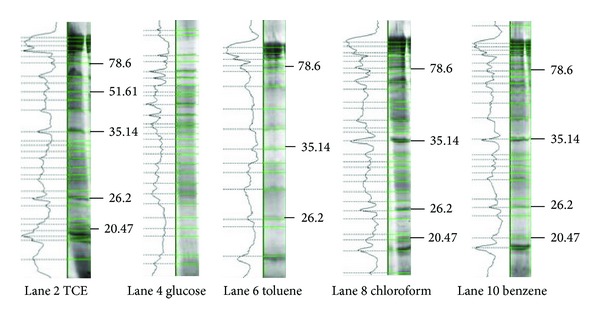
Figure 5.

Densitometric analysis of the 12% gel by Quantum Capt software showing the differential expression of proteins under varying culture conditions—0.1% peptone and 0.2% of TCE, glucose, toluene, chloroform, and benzene, respectively.

Densitometric analysis of the 12% gel by Quantum Capt software showing the differential expression of proteins under varying culture conditions—0.1% peptone and 0.2% of TCE, glucose, toluene, chloroform, and benzene, respectively.