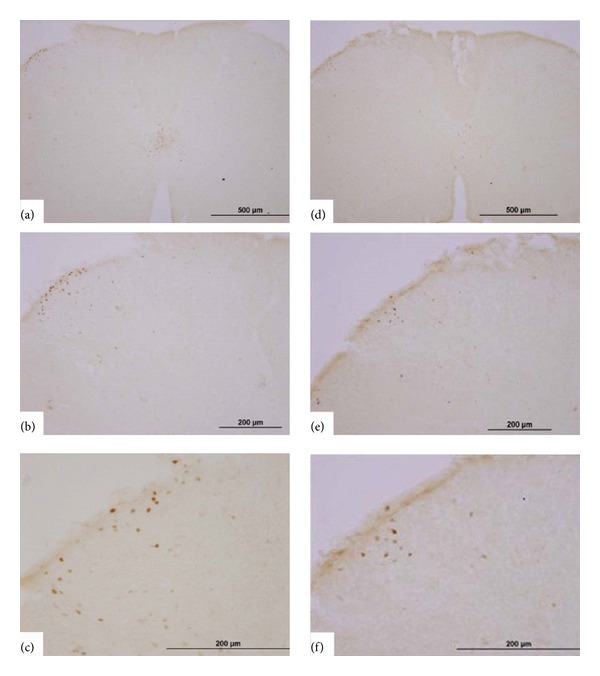
Figure 10.

Representative photomicrographs of c-Fos expression induced by GNTI in the spinal cord and the effects of EA. GNTI (0.6 mg/kg; s.c.; behind the neck) induced c-Fos expression on the lateral side of the superficial lamina of the dorsal horn of the cervical spinal cord without (a)–(c) and with (d)–(f) EA (2 Hz) pretreatment. (a)–(c) represent one spinal section, with increasing magnification, while (d)–(f) are from another spinal section, with increasing magnification.
