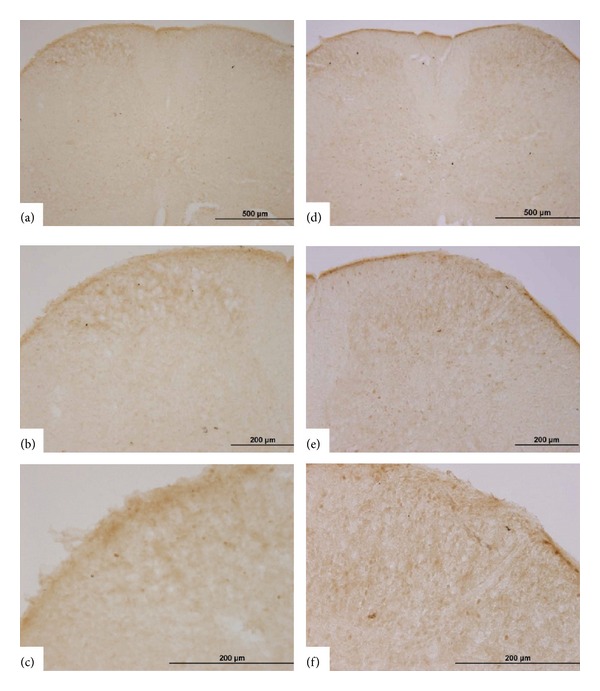
Figure 9.

Representative photomicrographs of c-Fos expression in the spinal cord. c-Fos was not detected in the superficial layers of the dorsal horn following saline injection (a)–(c) and after EA (2 Hz) application at the LI4 and LI11 acupoints (d)–(f). (a)–(c) represent one spinal section, with increasing magnification, while (d)–(f) are from another spinal section, with increasing magnification.
