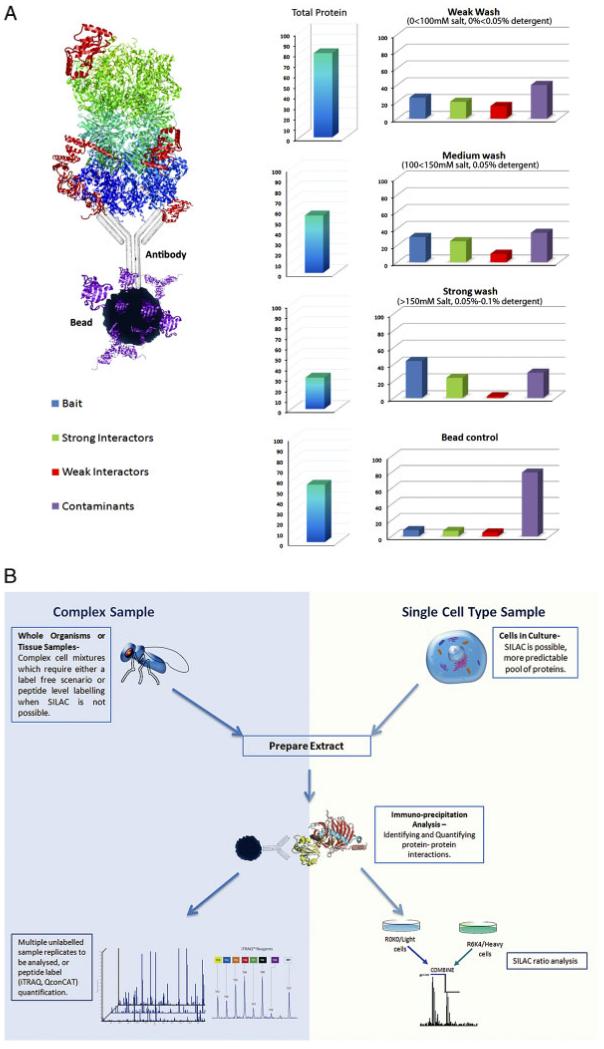
Figure 1.
(A) The above diagram characterises the relative changes (percentage of protein identified in IP results (right) and total percentage of protein as a fraction of cell extract (left)) in terms of the abundance of the proteins identified in response to different experimental procedures. Whether comparing intensities directly in a label-free experiment, or utilising a SILAC approach to quantify proteins, these changes should be taken into consideration. It also indicates the importance of having a bead control (non-specific proteins which bind to beads) characterised for every experiment – because the non-specific proteins identified in bead controls vary for different cell lines, antibodies, beads, etc. (B) The immuno-precipitation workflow. Protein–protein interactions analysis utilising IP techniques can be approached in many different ways, using complex samples such as tissue biopsies, or single cell-type samples, and with labelled or label-free scenarios, illustrated by the flow chart.

