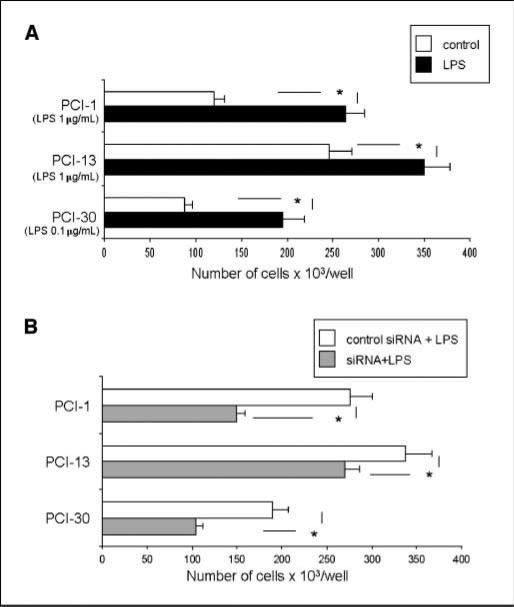
Figure 2.
Proliferation of tumor cells in response to LPS. A, PCI cell lines were incubated with 0.1 to 1.0 μg/mL of LPS. Each line was incubated with the LPS dose, which gives optimal tumor cell proliferation. Cells were counted on day 5 of culture. Control cultures contained no LPS. B, tumor cells were treated with TLR4-specific siRNA or with nonrelevant siRNA. A and B, columns, mean cell counts from three independent experiments; bars, SD. *, significant differences (P < 0.05) between experimental and control cultures.

