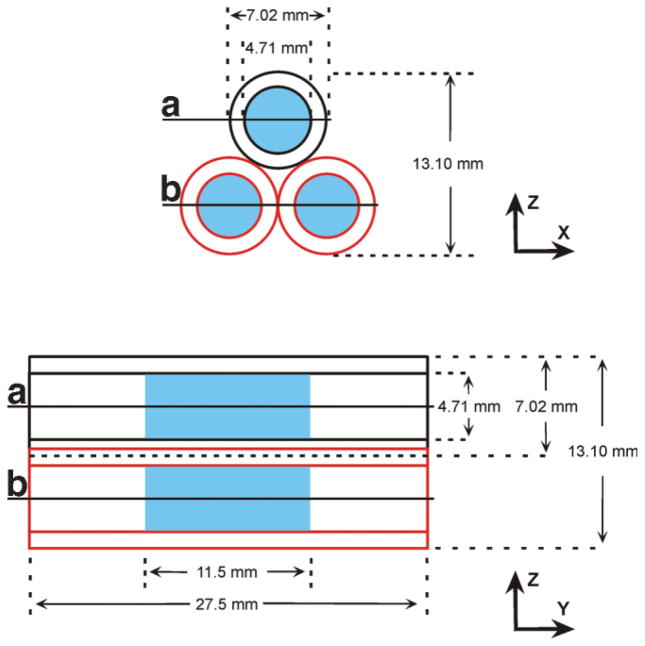
FIG 2.
Schematic representation of three-tube imaging phantom. The X-Z cross section shows the equilateral triangular arrangement of the tubes, with relevant dimensions indicated. The Y-Z projection view shows the same dimensions in addition to the length of each tube. Space occupied by the imageable sample is marked in blue. Lines A and B mark the approximate locations of the X-Y sections shown in Fig. 5b.

