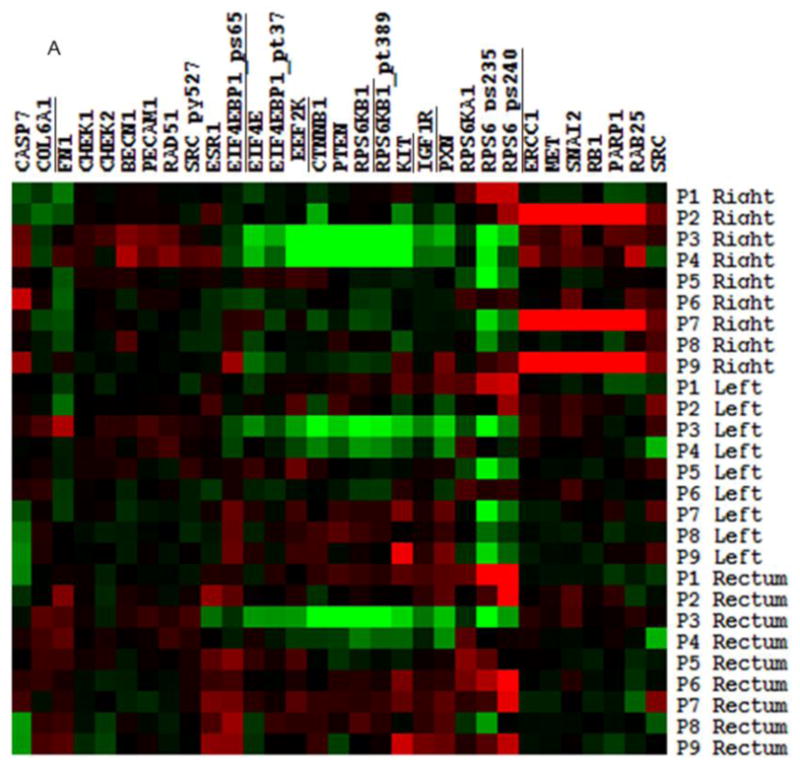
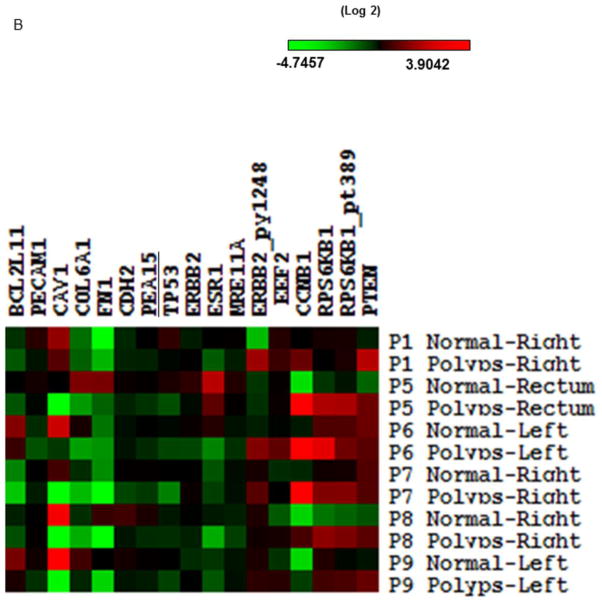
Figure 1.

Heatmap of RPPA. A, Protein expression was compared among different regions of the colon. B, Protein expression was compared between normal colon and adenomas. The vertical axis shows the proteins tested in the RPPA, and the horizontal axis shows the location/type of samples. The significant proteins after multiple test correction (q< 0.05) were underlined.

