Figure 4.
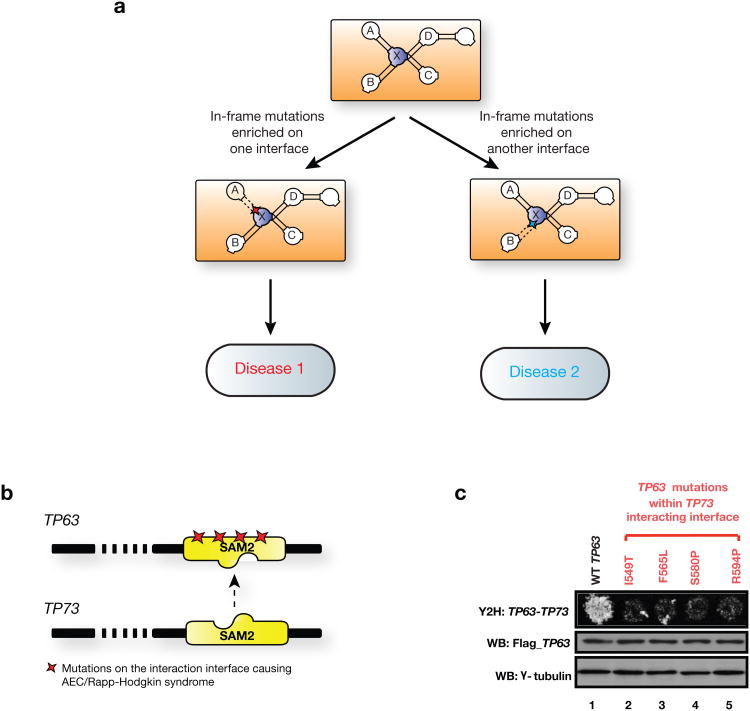
Modeling molecular mechanisms of disease genes and mutations through our structurally resolved interaction network. (a) Schematic illustration of using hSIN to understand complex genotype-to-phenotype relationships. In-frame mutations enriched on an interaction interface of protein X likely alter the interaction between protein X and A, leading to one disease, while mutations enriched on a different interface likely to alter the interaction between X and B, leading to another disease. Interactions between protein X and C, as well as X and D are likely to be intact under both scenarios. (b) Illustration of TP63 and its predicted interaction interface with TP73. Colored stars indicate locations of experimentally tested mutations. (c) Effects on the TP63-TP73 interaction by mutations on the predicted interacting interface tested by Y2H. Flag tagged wild-type and mutant TP63 were expressed in HEK293T cells, western blot analysis showed similar levels of TP63 proteins. γ -tubulin was used as a loading control.

