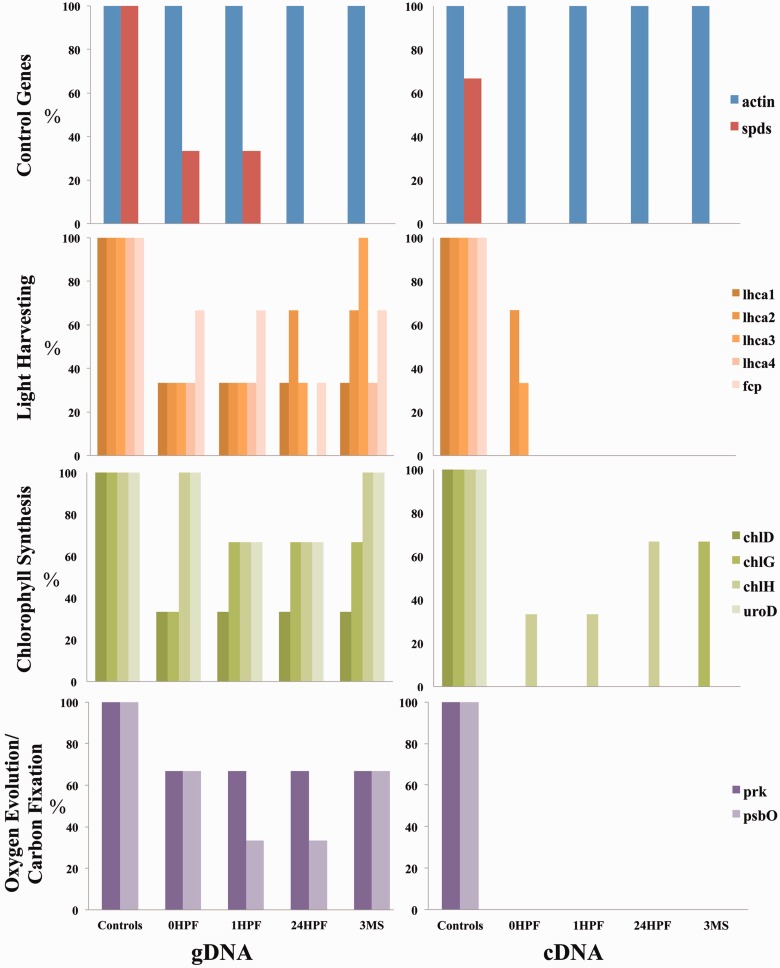
Fig. 4.
Percentage of animals (n = 3) showing the presence of genes (left) or transcripts (right) encoding 11 putative HGT candidates (divided into functional categories) and two control genes (actin and spermadine synthase). Tested animals were starved for 3 months (3MS) and then allowed to feed on Vaucheria litorea for 1 h (0HPF) and subsequently starved for 1 h (1HPF) or 24 h (24HPF). Controls indicate samples that had combined algal and animal nucleic acids as templates. Targeted genes are listed in table 1.

