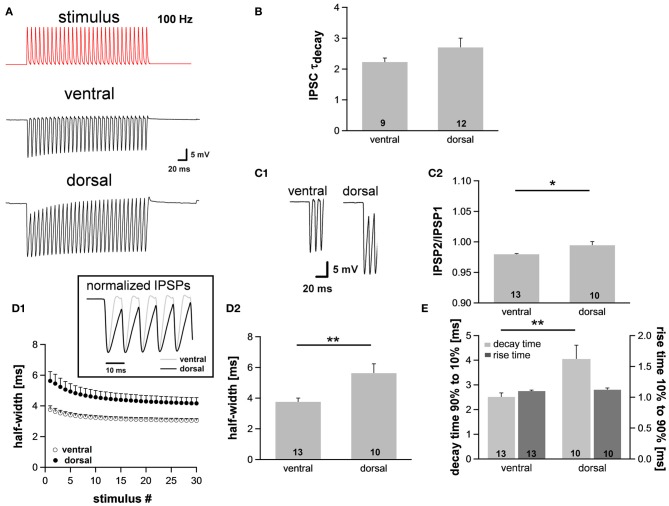
Figure 4.
The integration of synaptic inputs varies along the dorsoventral axis. (A) Representative voltage traces to simulated IPSC trains (100 Hz). (B) The time course of IPSCs does not vary along the dorsoventral axis as indicated by the decay time. IPSCs were evoked by stimulating the slice medial or lateral the MSO with a stimulation electrode. (C) Dorsal neurons exhibit the largest IPSP amplitude (C1), and IPSP summation is increased in dorsal neurons (C2). (D) IPSP time course changes along the dorsoventral axis as depicted in the inset. The half-width of IPSPs is largest in dorsal neurons and the time course accelerates during stimulation with IPSC trains (D1). Half-width for the first IPSP (D2). (E) There is no difference between the rise times (10–90%) of the first IPSP (dark-gray bars) but the mean values for the decay time (90–10%) of the last IPSP (light-gray bars) are larger in dorsal neurons compared to ventral neurons. Black symbols: dorsal neurons; white symbols: ventral neurons. *P < 0.05, **P < 0.01, two-tailed paired or unpaired t-test, as appropriate.

