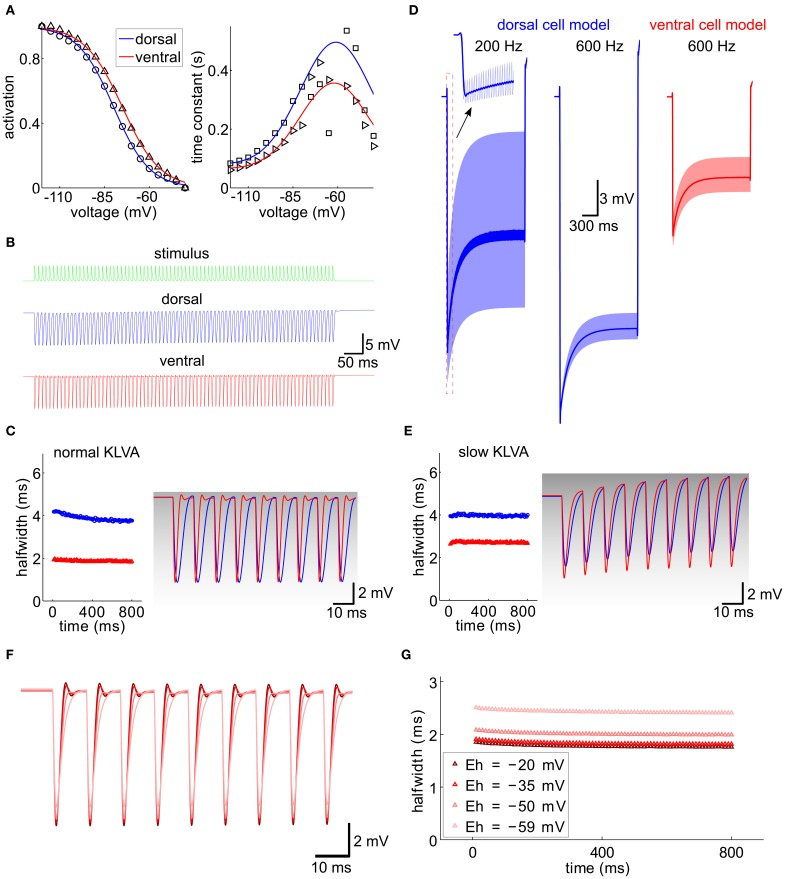
Figure 7.
Integration of IPSG trains, computational model. (A) Activation curve and time constant of Ih from Figure 5 (symbols) were fitted for the ventral and dorsal population (solid lines). (B) A 100 Hz IPSG train (green) was applied to the cell models representative for the dorsal (blue) and ventral (red) population (see Materials and Methods). The individual inhibitory conductance was set to 20.5 nS and 90 nS for the dorsal and for the ventral cell models to obtain similar voltage amplitudes. (C) Half-width of the resulting IPSPs from (B). The first nine IPSPs were magnified on the right and overlaid with the respective KLVA steady-state activation (gray levels). (D) Voltage responses (light colors) for different stimulus frequencies (as indicated) and model cells (colors). The dark traces were generated by low-pass filtering the voltage trace with a second-order Butterworth low-pass filter with cut-off frequency of 100 Hz. (E) Same as (C) for a KLVA model with 100-fold slowed down activation and inactivation time constants. Conductances for Ih and IK-LVA were adjusted to match the input resistances and equilibrium potential of the cells in (C). (F) IPSP trains for different reversal potentials of Ih (color code see G). (G) Half-widths of the IPSP trains from (F).

