
FIGURE 3.
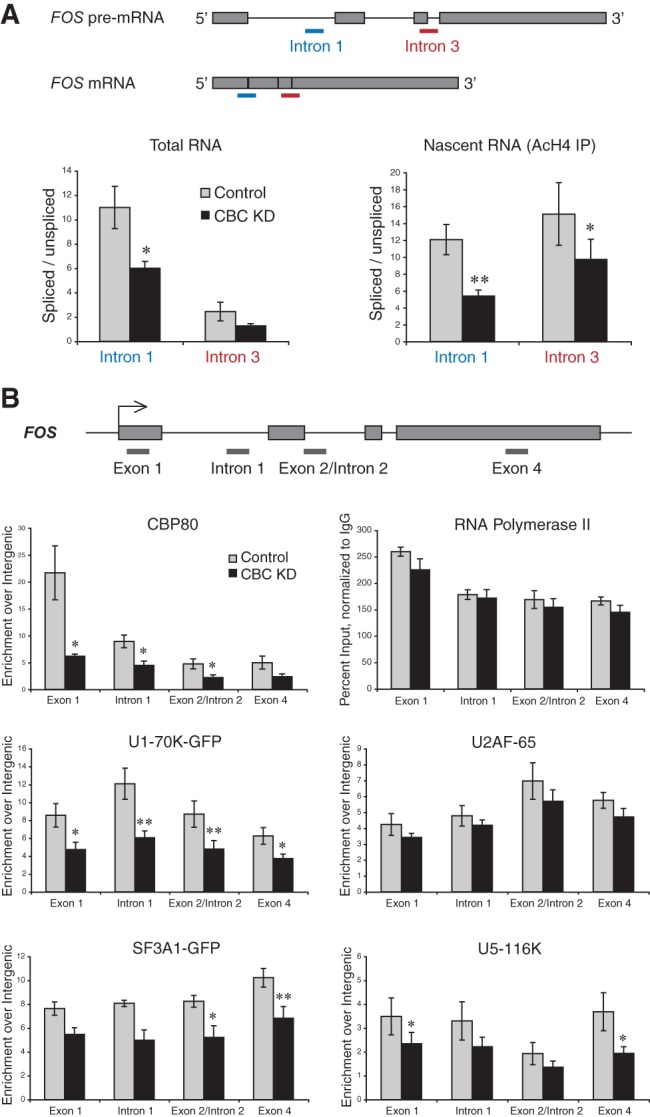
CBC depletion reduces cotranscriptional spliceosome assembly and splicing. HeLa cells transduced with control and α-CBP80 shRNA retroviral vectors were subjected to RNA isolation, ChRIP, or ChIP on day 6. (A) Schematic representation of FOS pre-mRNA and mRNA, showing the location of qPCR amplicons detecting RNA with either spliced or unspliced intron 1 (blue) and intron 3 (red). Total RNA (left panel) was reverse-transcribed with an oligo(dT) primer and the relative abundance of spliced to unspliced poly(A)+ RNA assessed by qPCR. Nascent RNA (right panel) was isolated by ChRIP from an α-AcH4 IP and reverse-transcribed, using a primer in intron 2 (for intron 1 splicing) or in exon 4 (for intron 3 splicing). qPCR was conducted to assess the relative abundance of spliced to unspliced RNA. n ≥ 4; error bars are the SEM. (B) Schematic representation of the FOS gene. (Gray lines) The location of qPCR amplicons used in ChIP. The following antibodies were used: α-CBP80, α-Pol II-CTD (4H8), α-U2AF-65 (MC3), α-U5-116K, and α-GFP in case of transgenic cell lines expressing U1-70K-GFP or SF3A1-GFP. All values were calculated as percent input, normalized to nonimmune ChIP, and presented as fold enrichment over an intergenic region. In Pol II ChIP, normalization to intergenic was omitted due to absence of background. N ≥ 3; error bars are the SEM. Significant differences between knockdown and control determined by the Student’s t-test: (*) P < 0.05, (**) P < 0.01.